Fig. 8
Download original image
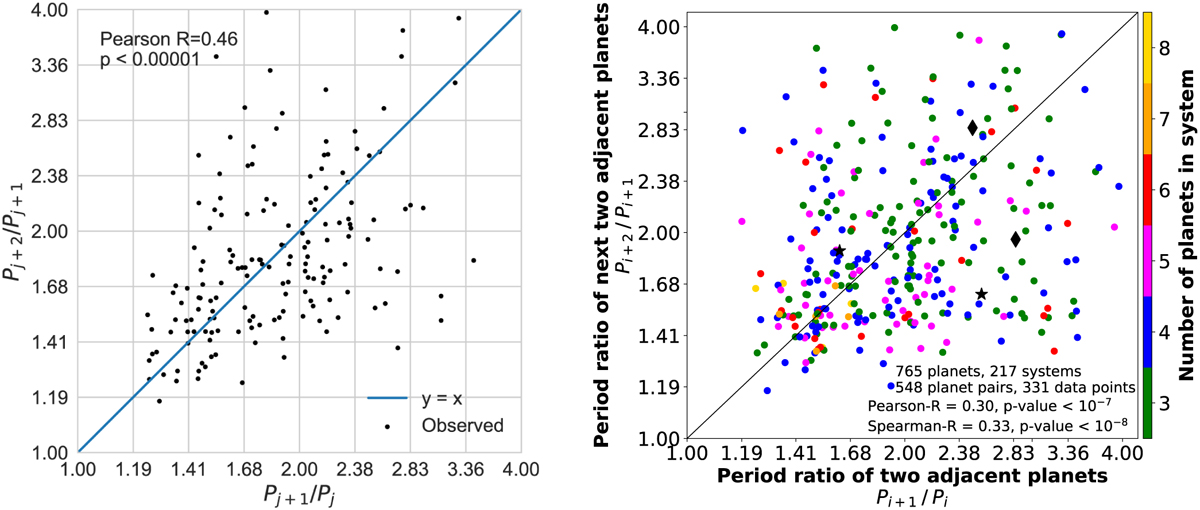
As in Fig. 7 but now only for PRs < 4. Left figure: graph from Weiss et al. (2018b) displaying 165 data points from a total of 104 systems and 373 planets. This has been the largest observed sample for which a strong similarity of adjacent spacings has been found. Right figure: sample from the period catalogue in this work comprising 331 data points from a total of 217 systems, 548 planet pairs, and 765 planets. Although this sample is smaller than that in Fig. 7, it is twice as large as that of Weiss et al. (2018b) and shows a weaker, but more significant, correlation.
Current usage metrics show cumulative count of Article Views (full-text article views including HTML views, PDF and ePub downloads, according to the available data) and Abstracts Views on Vision4Press platform.
Data correspond to usage on the plateform after 2015. The current usage metrics is available 48-96 hours after online publication and is updated daily on week days.
Initial download of the metrics may take a while.