Fig. 7.
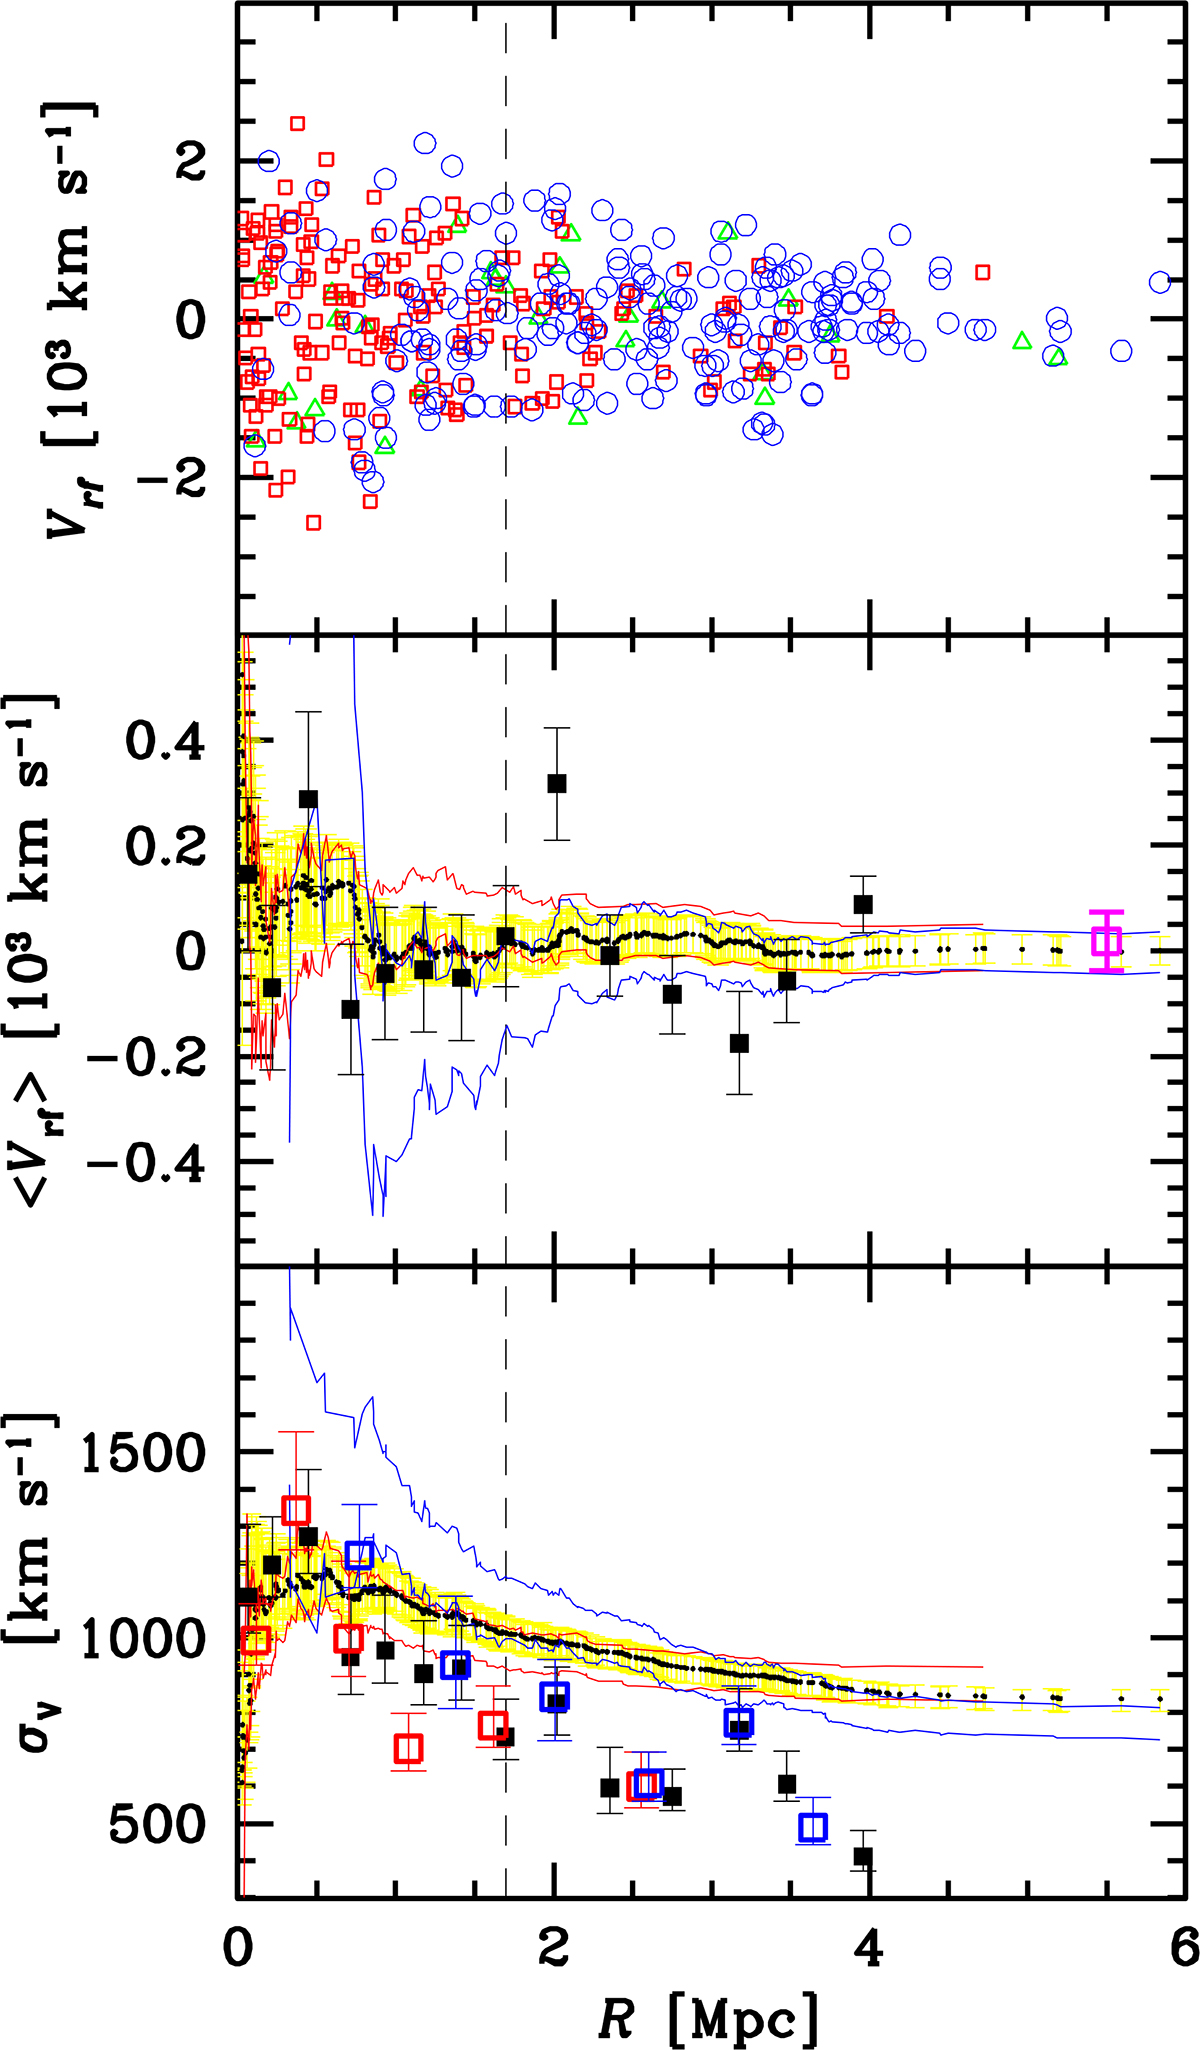
Download original image
Projected phase space and profiles of mean velocity and velocity dispersion for the member galaxies of MACS0329. Top panel: Projected phase space. The red, green, and blue symbols show red, intermediate, and blue galaxies as classified in Sect. 5 (418 galaxies; see Fig. 8). Middle panel: Mean rest-frame velocity profile for the 430 member galaxies (black full squares with error bars). Each value was computed using 30 galaxies. The small black dots show the integral profile of the mean velocity and converge by definition toward the global value ⟨Vrf⟩ = 0. The error ranges are shown by yellow lines. The magenta point indicates the rest-frame BCG velocity with its 2σ uncertainty. It is located at a large radius for easy comparison with the global value of the mean velocity. For the integral profiles calculated for blue and red galaxies, only the 1σ errors are shown (red and blue bands respectively). Bottom panel: Same as above but for the velocity dispersion profile. The integral profile for all galaxies (small black dots) converges toward the global value of σV. Red and blue open squares indicate differential profiles for red and blue galaxies. The vertical dashed lines in the three panels indicate the R200 radius.
Current usage metrics show cumulative count of Article Views (full-text article views including HTML views, PDF and ePub downloads, according to the available data) and Abstracts Views on Vision4Press platform.
Data correspond to usage on the plateform after 2015. The current usage metrics is available 48-96 hours after online publication and is updated daily on week days.
Initial download of the metrics may take a while.