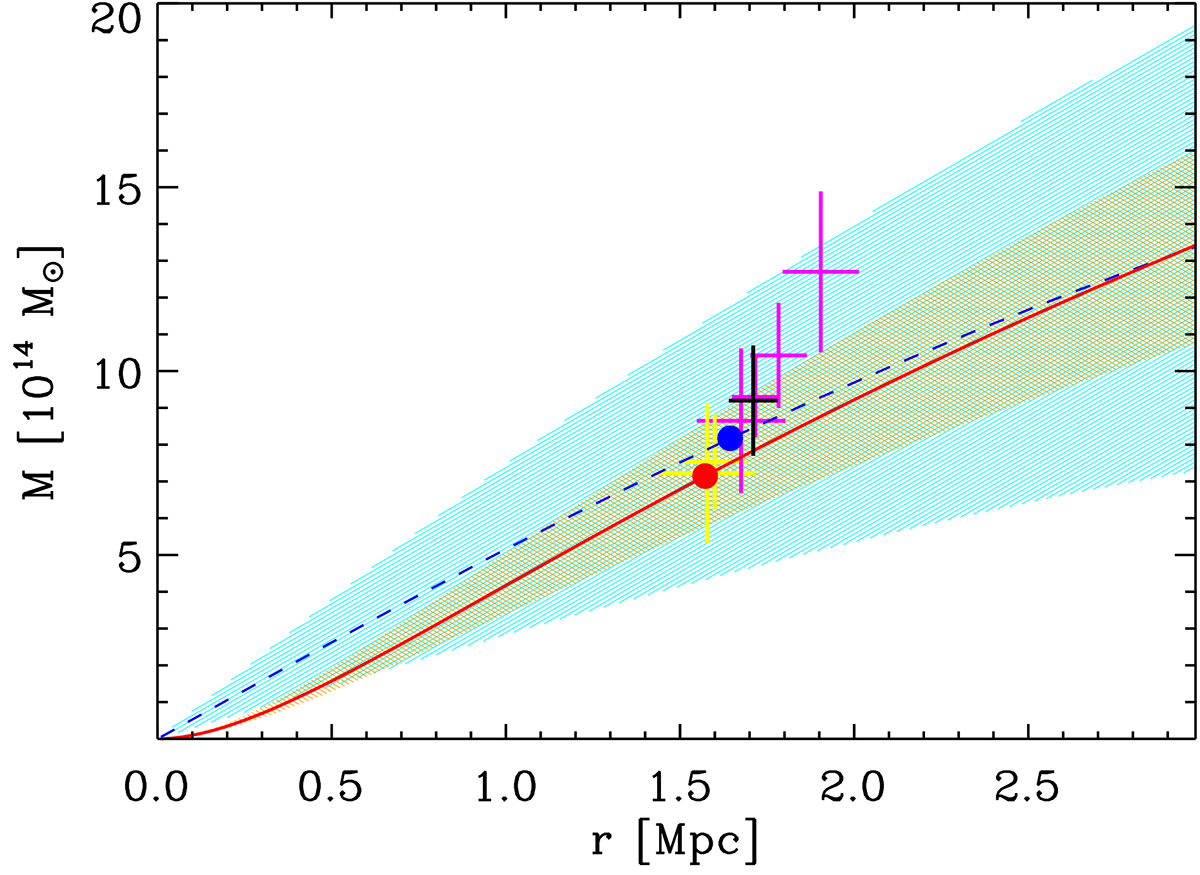
Fig. 6.
Download original image
Cluster mass profile M(r). The MAMPOSSt solution is shown with a solid red line (best fit) and orange shading (68% confidence level). The caustic solution is shown with a dashed blue line (best fit) and cyan shading (68% confidence level). The dots represent the positions of (R200, M200) in the MAMPOSSt (red) and caustic (blue) M(r). The crosses stand for other determinations of (R200, M200) with the respective one σ error bars. The black cross is our determination based on the scaling relation with the cluster velocity dispersion (the value also given in Table 1). The two yellow crosses are determinations based on the hydrostatic equilibrium of the intracluster X-ray emitting gas and the four magenta crosses are determinations based on gravitational lensing effect. The references to these values are, from left to right in the figure: Schmidt & Allen (2007), Donahue et al. (2014), Umetsu et al. (2016, 2018), Herbonnet et al. (2019), Merten et al. (2015).
Current usage metrics show cumulative count of Article Views (full-text article views including HTML views, PDF and ePub downloads, according to the available data) and Abstracts Views on Vision4Press platform.
Data correspond to usage on the plateform after 2015. The current usage metrics is available 48-96 hours after online publication and is updated daily on week days.
Initial download of the metrics may take a while.