Fig. 3.
Download original image
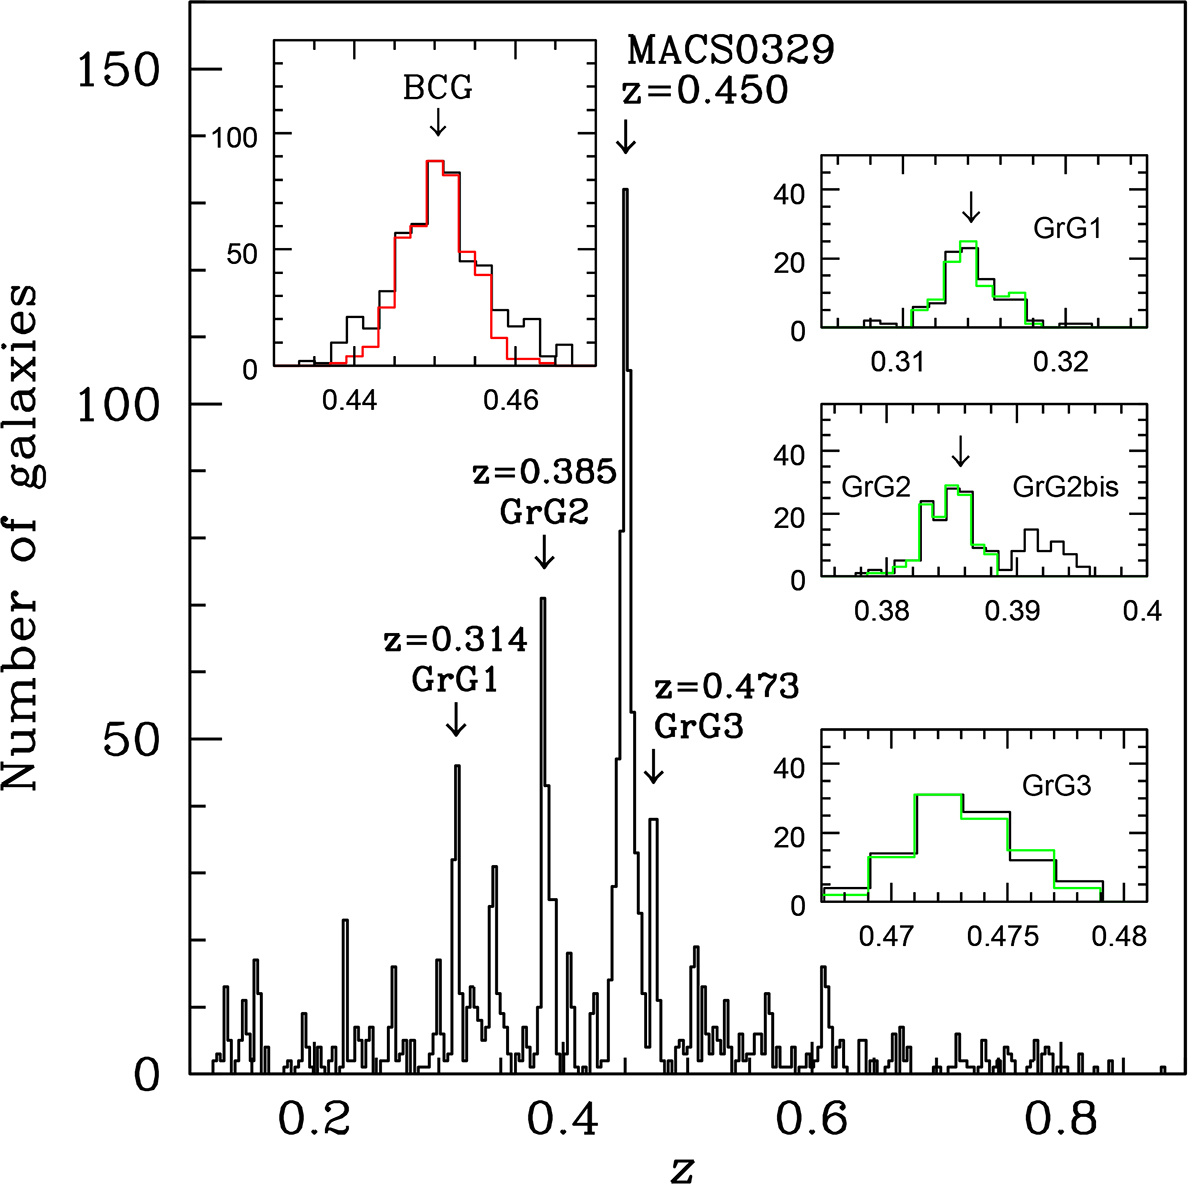
Distribution of galaxy redshifts. The histogram refers to the galaxies with the spectroscopic redshift in the region of MACS0329 with 0.1 < z < 0.9. Labels indicate redshifts of the relevant peaks and the names of the corresponding galaxy systems, that is MACS0329 and other groups (see Table 2). The redshift distribution of the 533 galaxies assigned to the MACS0329 peak can be seen in the inset plot at the top left (black line histogram). The histogram with the red line refers to the 430 galaxies that are members. The BCG redshift is also shown. For each of the other groups, the respective right-hand inset panel shows the redshift distribution of the galaxies assigned to the peak and the galaxies selected as members (black and green line histograms, respectively, see Sect. 7). For GrG1 and GrG2, the arrows indicate the redshifts of the luminous galaxies that we have selected as the centers of the groups.
Current usage metrics show cumulative count of Article Views (full-text article views including HTML views, PDF and ePub downloads, according to the available data) and Abstracts Views on Vision4Press platform.
Data correspond to usage on the plateform after 2015. The current usage metrics is available 48-96 hours after online publication and is updated daily on week days.
Initial download of the metrics may take a while.