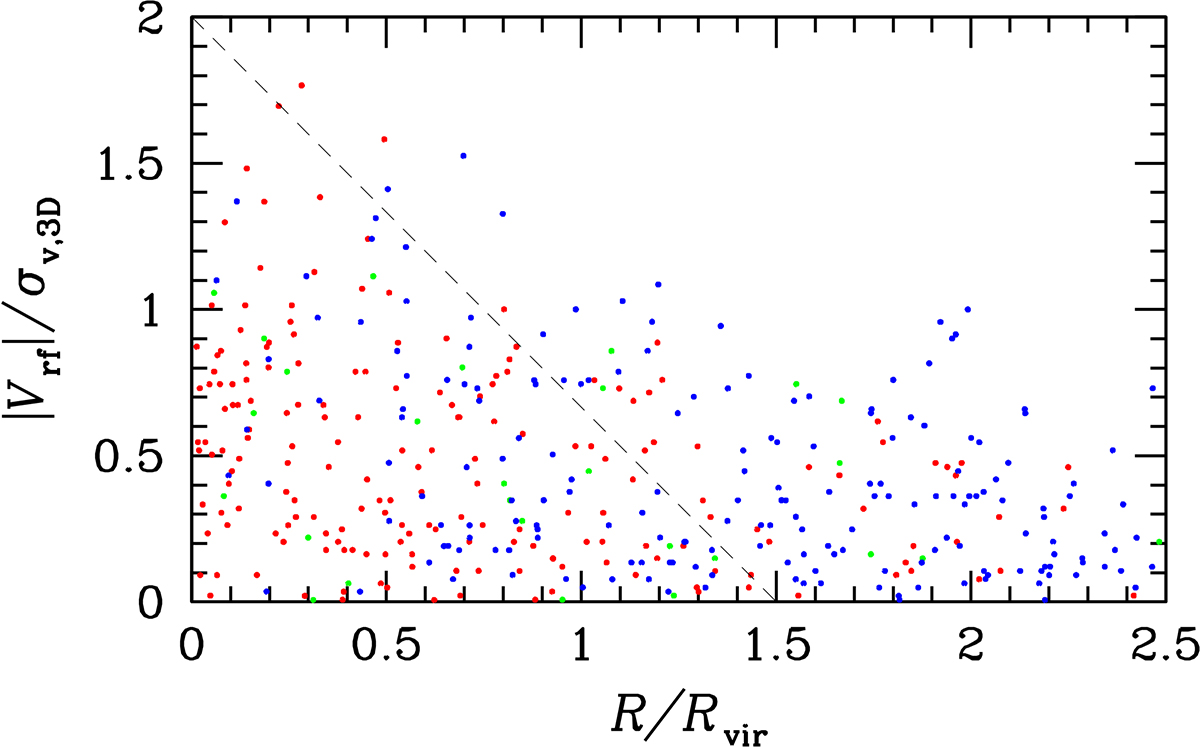
Fig. 20.
Download original image
Projected phase space distribution of galaxies per different color type (red, green, and blue colors for Red, Green, and Blue samples) showing normalized velocities versus normalized projected cluster-centric distance. The dashed diagonal line separates the regions where most galaxies are expected to have an infall time of more or less than 1 Gyr according to the simulations by Oman et al. (2013).
Current usage metrics show cumulative count of Article Views (full-text article views including HTML views, PDF and ePub downloads, according to the available data) and Abstracts Views on Vision4Press platform.
Data correspond to usage on the plateform after 2015. The current usage metrics is available 48-96 hours after online publication and is updated daily on week days.
Initial download of the metrics may take a while.