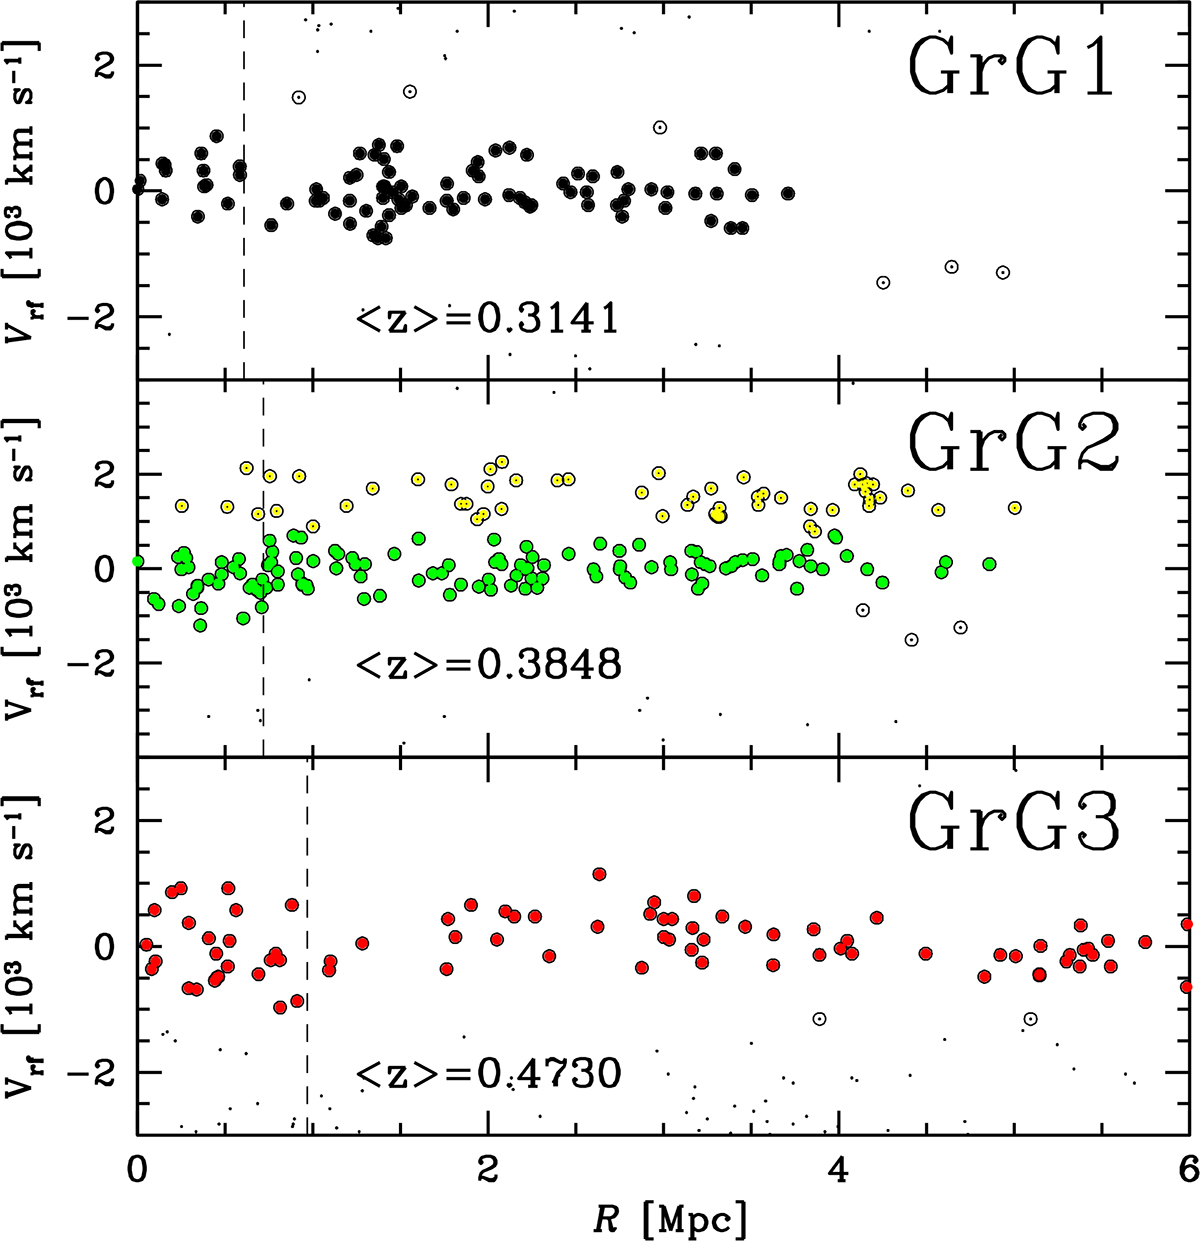
Fig. 17.
Download original image
Projected phase spaces of the three galaxy systems (GrG1, GrG2, and GrG3 in the top, middle, and bottom panels, respectively). For each system, the rest-frame velocity, Vrf, and the distance R have been computed using the group mean velocity and group center. Circles indicate galaxies that belong to the velocity peak. Full circles indicate the group members (black, green and red colors for GrG1, GrG2 and GrG3, respectively). Middle panel also shows the galaxies of a secondary peak (GrG2bis, yellow color). For each group, the vertical line shows the R200 radius and the mean redshift of the system is given (see also Table 8).
Current usage metrics show cumulative count of Article Views (full-text article views including HTML views, PDF and ePub downloads, according to the available data) and Abstracts Views on Vision4Press platform.
Data correspond to usage on the plateform after 2015. The current usage metrics is available 48-96 hours after online publication and is updated daily on week days.
Initial download of the metrics may take a while.