Fig. 13.
Download original image
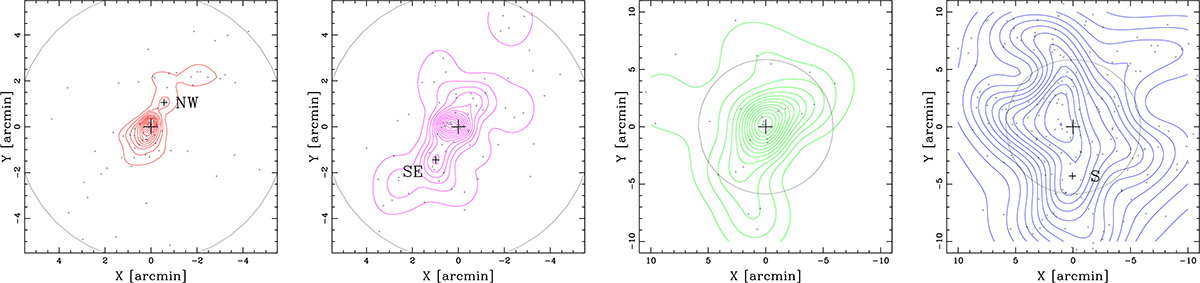
Spatial distributions and isodensity contour maps for the four color classes: RedU, RedD, Green, and Blue samples (from left to right panels). In each panel, we show the region of interest. The large and small crosses in each box show the position of the BCG and secondary density peaks (see Table 7). The R200 region is highlighted by the circle, which is centered on the BCG.
Current usage metrics show cumulative count of Article Views (full-text article views including HTML views, PDF and ePub downloads, according to the available data) and Abstracts Views on Vision4Press platform.
Data correspond to usage on the plateform after 2015. The current usage metrics is available 48-96 hours after online publication and is updated daily on week days.
Initial download of the metrics may take a while.