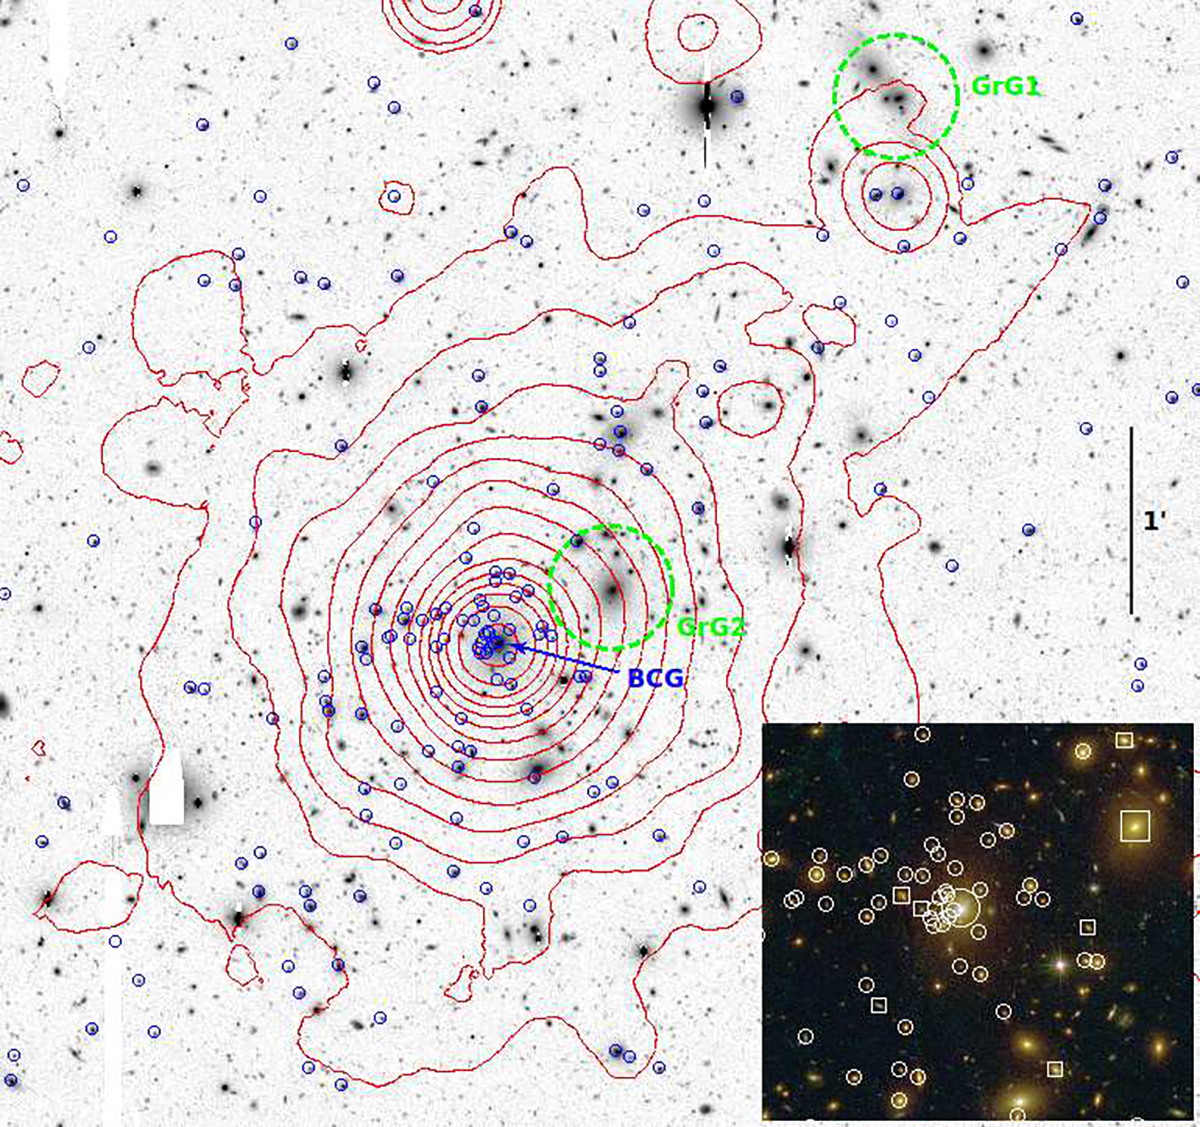
Fig. 1.
Download original image
Suprime-Cam RC-band image (north top and east left) of the MACS0329 field with superimposed isocontour levels of the Chandra X-ray emission (energy range: 0.5−7 keV). Only the main cluster region is shown. Small blue circles mark cluster members (see Sect. 3). The blue label indicates the brightest cluster galaxy. Green labels and large circles indicate the two foreground groups (GrG1 at z = 0.314 and GrG2 at z = 0.385) projected onto the field of the cluster (see Sect. 7). The inset shows a color composite image of the central region (1.5 × 1.5 arcmin2) from the CLASH survey (Postman et al. 2012), which combines HST/ACS and WFC3 passbands. Member galaxies of MAC0329 and GrG2 are indicated by circles and squares, respectively (large symbols indicate the two brightest members of MACS0329 and GrG2).
Current usage metrics show cumulative count of Article Views (full-text article views including HTML views, PDF and ePub downloads, according to the available data) and Abstracts Views on Vision4Press platform.
Data correspond to usage on the plateform after 2015. The current usage metrics is available 48-96 hours after online publication and is updated daily on week days.
Initial download of the metrics may take a while.