Fig. 6.
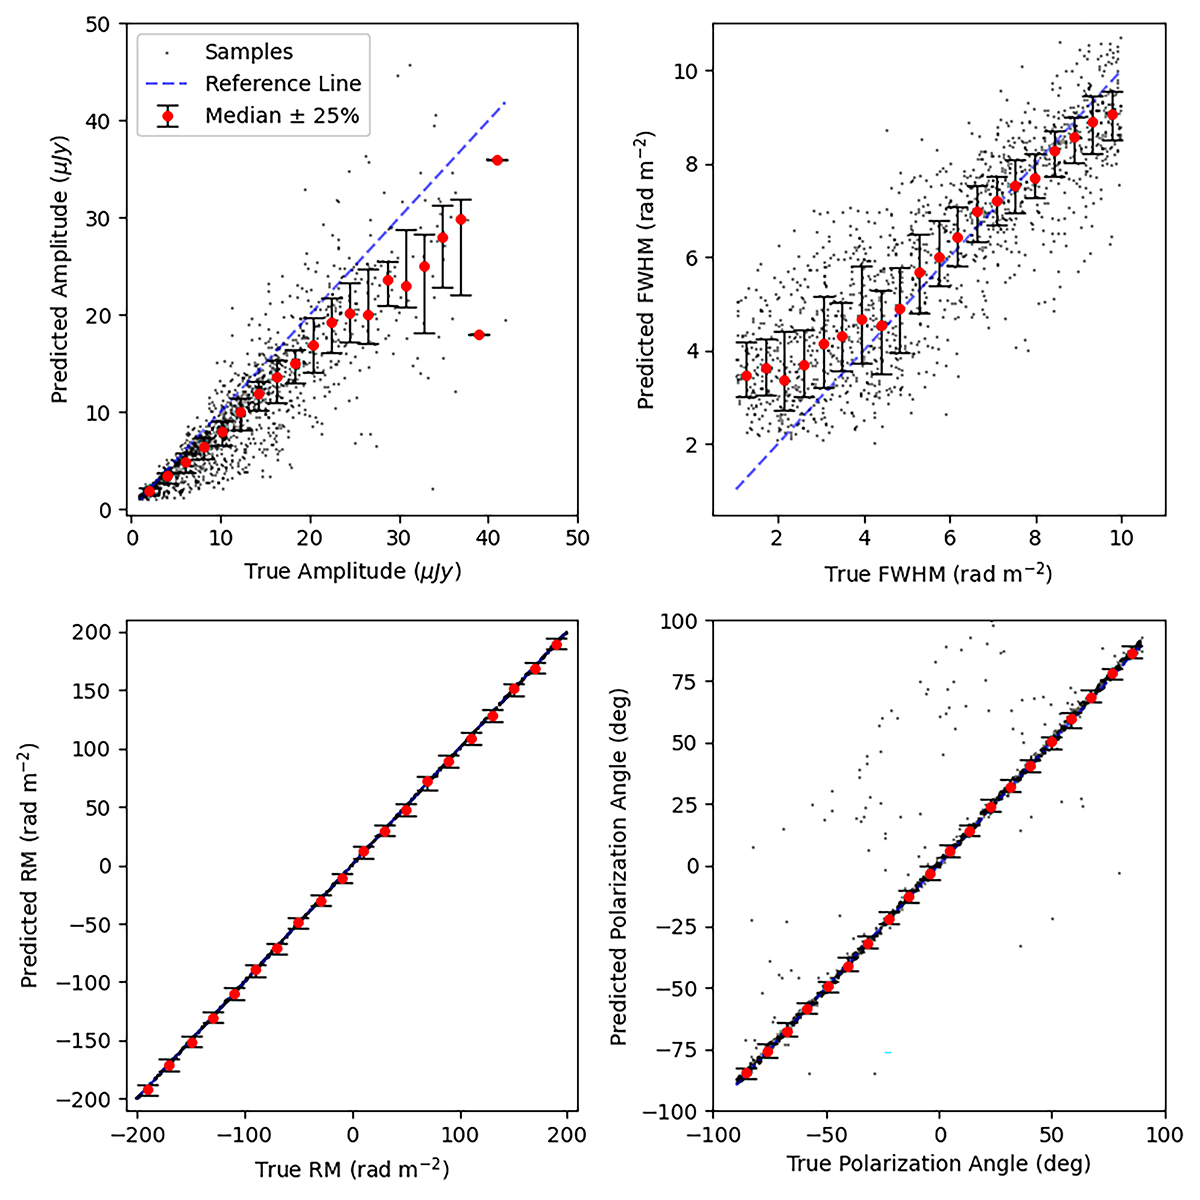
Download original image
Predicted versus true parameters from Gaussian fittings of the Faraday dispersion. The parameters are amplitude (top left), FWHM (top right) RM (bottom left) and intrinsic polarization angle (bottom right). Predicted values are shown as black dots. The range is divided into 20 bins from which the median ±25% are calculated and shown as red dots and errorbars respectively. A reference line where the predicted value equals the true value is shown as a dashed blue line. Predictions of the polarization angle with an error larger than π/2 radians are adjusted by ±π to account for the π-periodicity of the signal.
Current usage metrics show cumulative count of Article Views (full-text article views including HTML views, PDF and ePub downloads, according to the available data) and Abstracts Views on Vision4Press platform.
Data correspond to usage on the plateform after 2015. The current usage metrics is available 48-96 hours after online publication and is updated daily on week days.
Initial download of the metrics may take a while.