Fig. 2.
Download original image
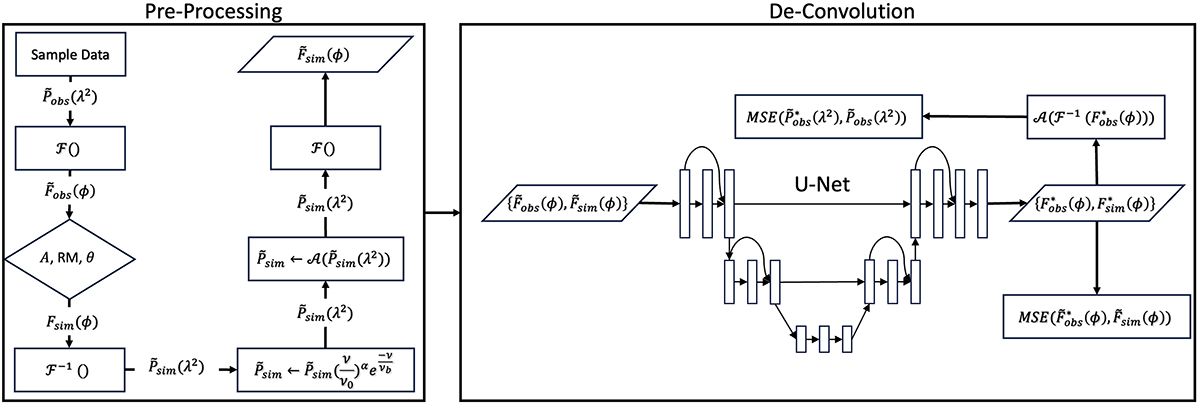
Flowchart illustrating our deep learning deconvolution model. The notations ℱ and ℱ−1 signify the transformations from λ2 to ϕ and back, respectively. Initially, samples are extracted from the observed data and used to generate a simulated dataset with a similar distribution. Next, the two datasets are combined and fed into the neural network. After the deconvolution process, the predictions Fobs* and Fsim* are separated once more and evaluated against their corresponding targets using the MSE loss.
Current usage metrics show cumulative count of Article Views (full-text article views including HTML views, PDF and ePub downloads, according to the available data) and Abstracts Views on Vision4Press platform.
Data correspond to usage on the plateform after 2015. The current usage metrics is available 48-96 hours after online publication and is updated daily on week days.
Initial download of the metrics may take a while.