Open Access
Fig. 8
Download original image
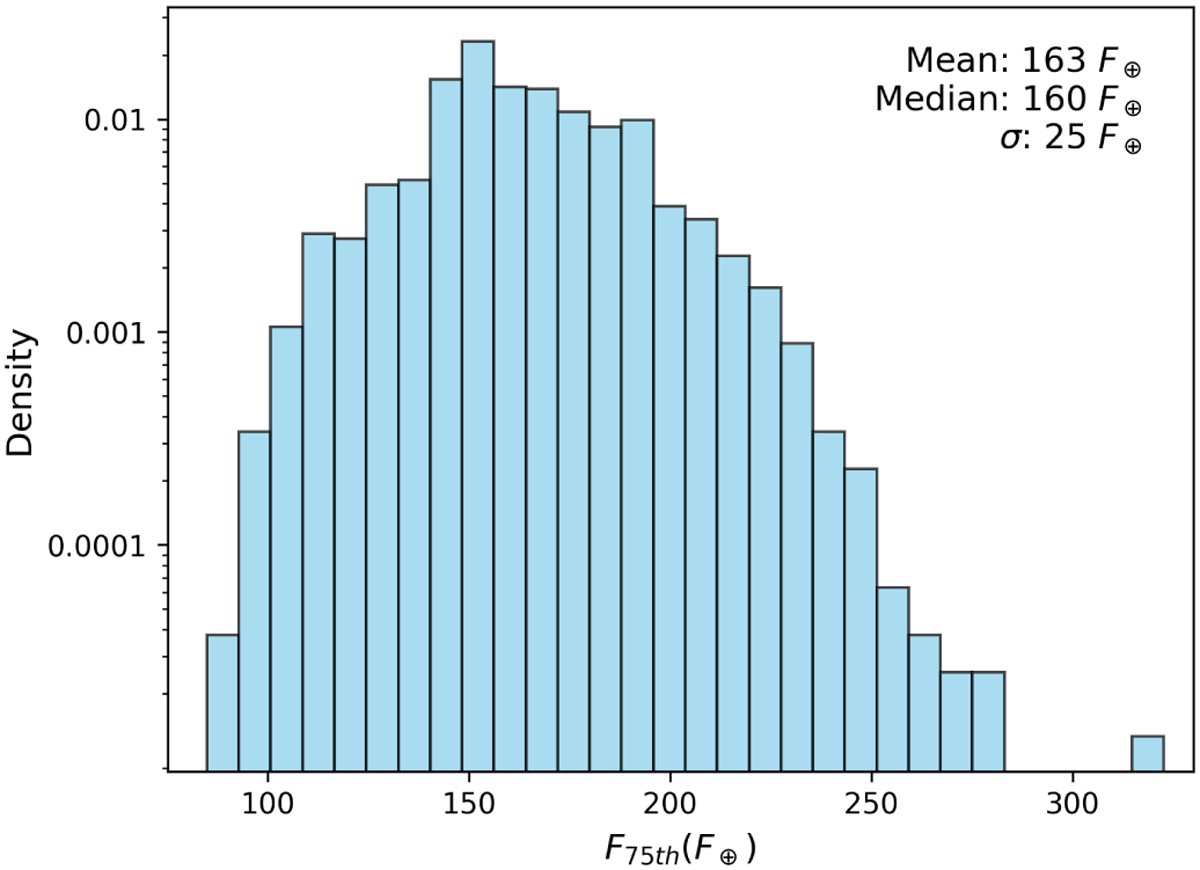
Histogram of the variable F75th for planets with 3 R⊕ ≤ Rp ≤ 11 R⊕, generated from 10 000 Monte Carlo simulations. Each simulation reduced the S1 sample to the size of the S2 and calculated the 75th percentile of exoplanets with 3 R⊕ ≤ Rp ≤ 11 R⊕ . The histogram is normalised to show the probability density.
Current usage metrics show cumulative count of Article Views (full-text article views including HTML views, PDF and ePub downloads, according to the available data) and Abstracts Views on Vision4Press platform.
Data correspond to usage on the plateform after 2015. The current usage metrics is available 48-96 hours after online publication and is updated daily on week days.
Initial download of the metrics may take a while.