Fig. 2
Download original image
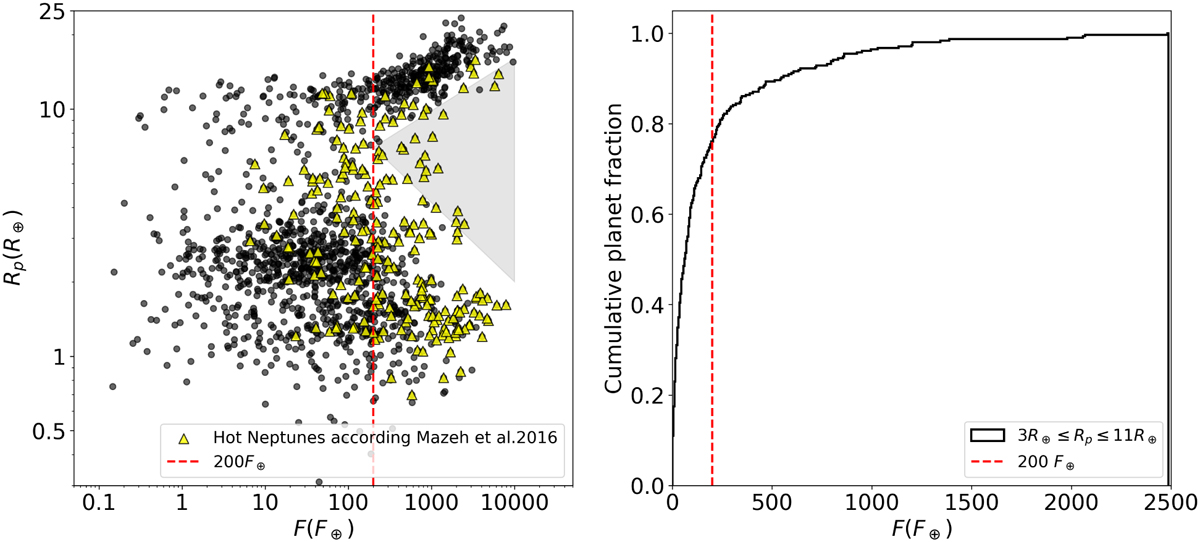
Analysis of the planetary distribution in the F – Rp plane and the flux cumulative distribution function. Left panel: distribution of the 1527 planets of the S1 set in the F – Rp plane. The yellow triangles represent planets that would be referred to as hot Neptunes according to the limits obtained by Mazeh et al. (2016). The grey triangle is a qualitative representation of the desert. Right panel: cumulative distribution function of incident flux values F of planets with 3 R⊕ ≤ Rp ≤ 11 R⊕. The vertical dashed line in both panels represents the threshold value of 200 F⊕ below which lie 75% of the planets with 3 R⊕ ≤ Rp ≤ 11 R⊕.
Current usage metrics show cumulative count of Article Views (full-text article views including HTML views, PDF and ePub downloads, according to the available data) and Abstracts Views on Vision4Press platform.
Data correspond to usage on the plateform after 2015. The current usage metrics is available 48-96 hours after online publication and is updated daily on week days.
Initial download of the metrics may take a while.