Fig. 12
Download original image
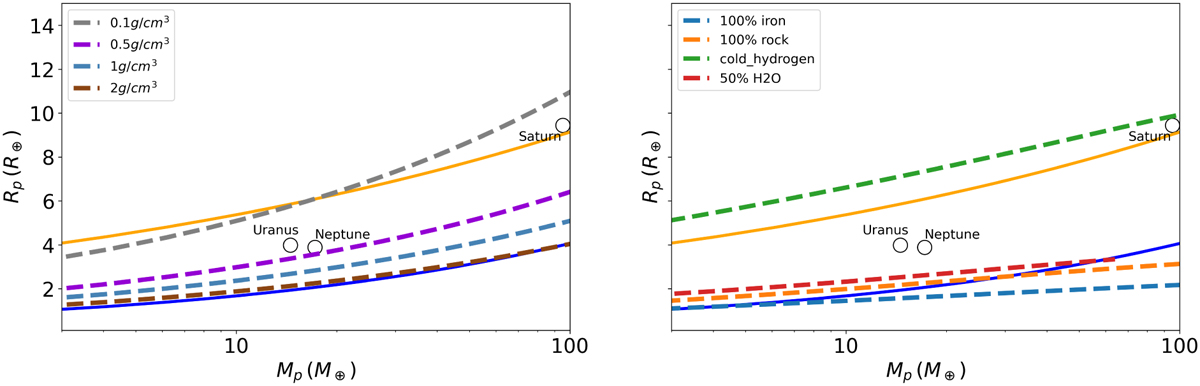
Mass-radius relations for the upper (orange line) and lower boundary (blue line) given by Eqs. (14) and (15), respectively. We present different curves at fixed density (left). While the upper boundary is consistent with a very low mean planetary density (≈0.1 g/cm3), the lower boundary comprises different values spanning from ≈1 g/cm3 to ≈2g/cm3. We also present different mass-radius curves for different planetary compositions (right).
Current usage metrics show cumulative count of Article Views (full-text article views including HTML views, PDF and ePub downloads, according to the available data) and Abstracts Views on Vision4Press platform.
Data correspond to usage on the plateform after 2015. The current usage metrics is available 48-96 hours after online publication and is updated daily on week days.
Initial download of the metrics may take a while.