Fig. 11
Download original image
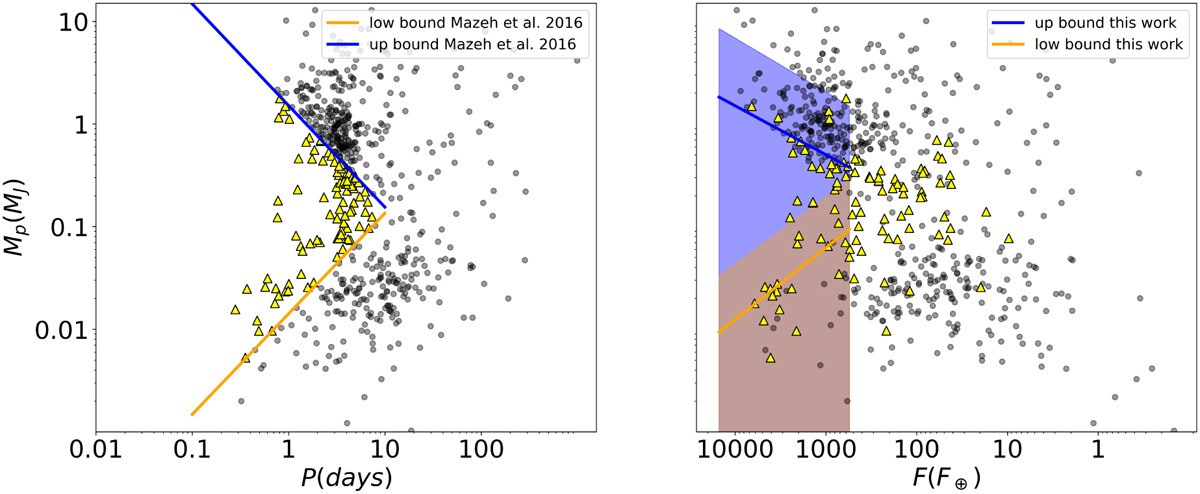
Comparison of the S3 sample distribution in the P – Mp and F – Mp planes to highlight the irradiation desert. Left: distribution of the S3 sample in the P– Mp diagram along the edges obtained by Mazeh et al. (2016). The yellow dots represent the 110 hot Neptunes within S3 according to the definition of Mazeh et al. (2016) in the P – Mp plane. The black dots represent planets outside the desert. Right: distribution of our sample in the F – Mp plane. The orange and blue lines represent the lower and upper boundary obtained in Sect. 3.2 alongside their confidence bands (1σ). The red dots show that 63 out of 110 objects experience an incident flux lower than 550 F⊕. The yellow triangles used to designate the hot Neptunes in the P – Mp diagram still refer to the same planets in the right plot.
Current usage metrics show cumulative count of Article Views (full-text article views including HTML views, PDF and ePub downloads, according to the available data) and Abstracts Views on Vision4Press platform.
Data correspond to usage on the plateform after 2015. The current usage metrics is available 48-96 hours after online publication and is updated daily on week days.
Initial download of the metrics may take a while.