Fig. 1
Download original image
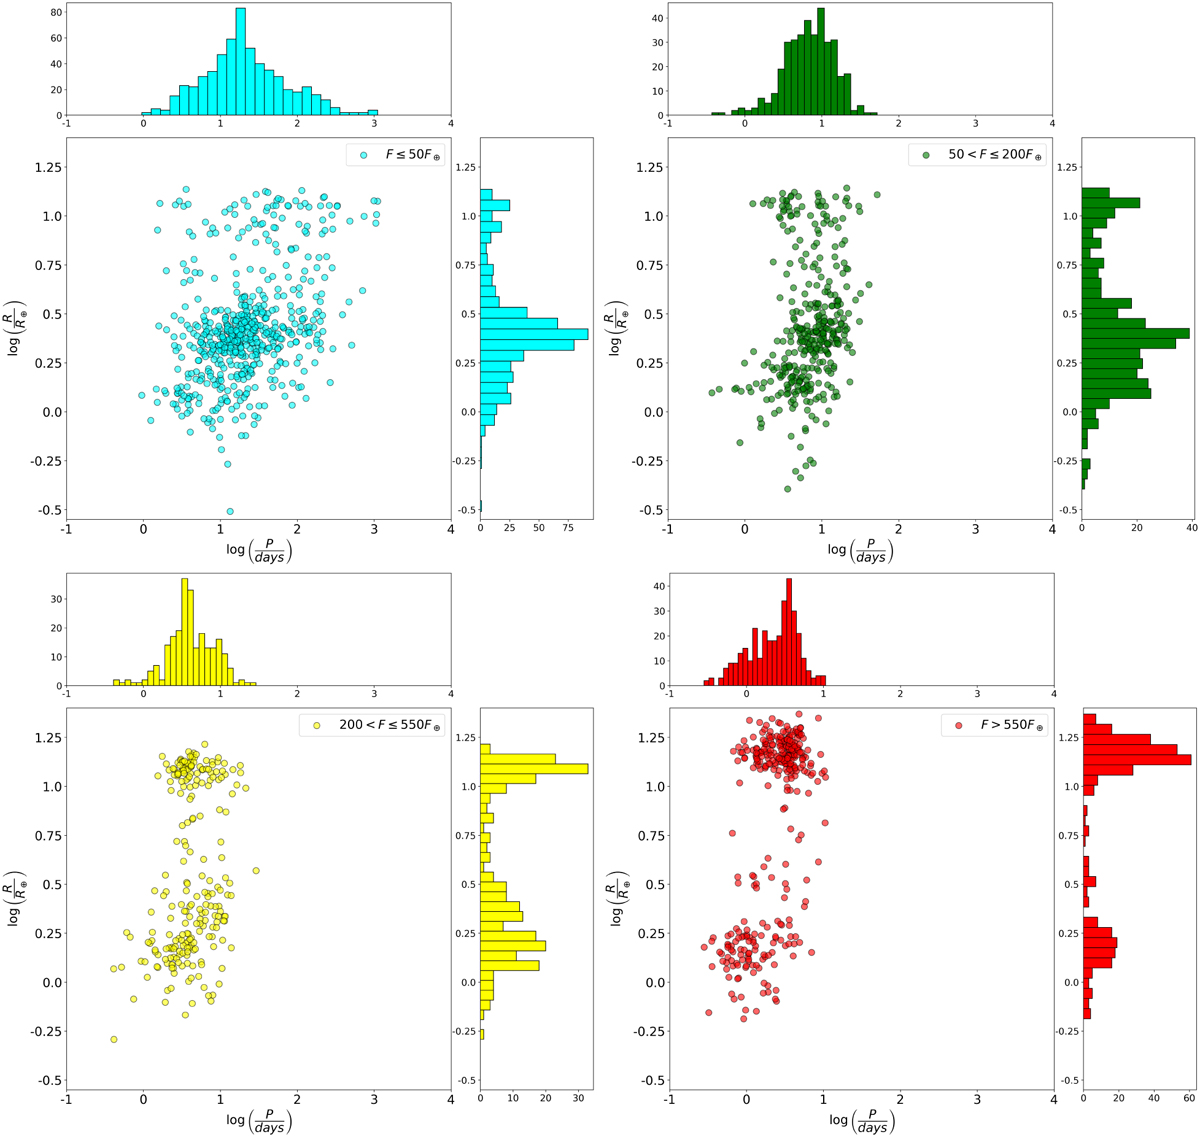
Distribution of the confirmed exoplanets of the S1 sample in the log P – log Rp diagram for different ranges of the insulation flux. The upper left panel shows the 586 planets that receive ≤50 F⊕, the upper right panel shows the 364 planets that receive between 50 F⊕ and 200 F⊕, the lower left panel depicts the 238 planets that receive between 200 F⊕ and 550 F⊕, and the lower right panel illustrates the 339 planets with F > 550 F⊕.
Current usage metrics show cumulative count of Article Views (full-text article views including HTML views, PDF and ePub downloads, according to the available data) and Abstracts Views on Vision4Press platform.
Data correspond to usage on the plateform after 2015. The current usage metrics is available 48-96 hours after online publication and is updated daily on week days.
Initial download of the metrics may take a while.