Open Access
Fig. 7
Download original image
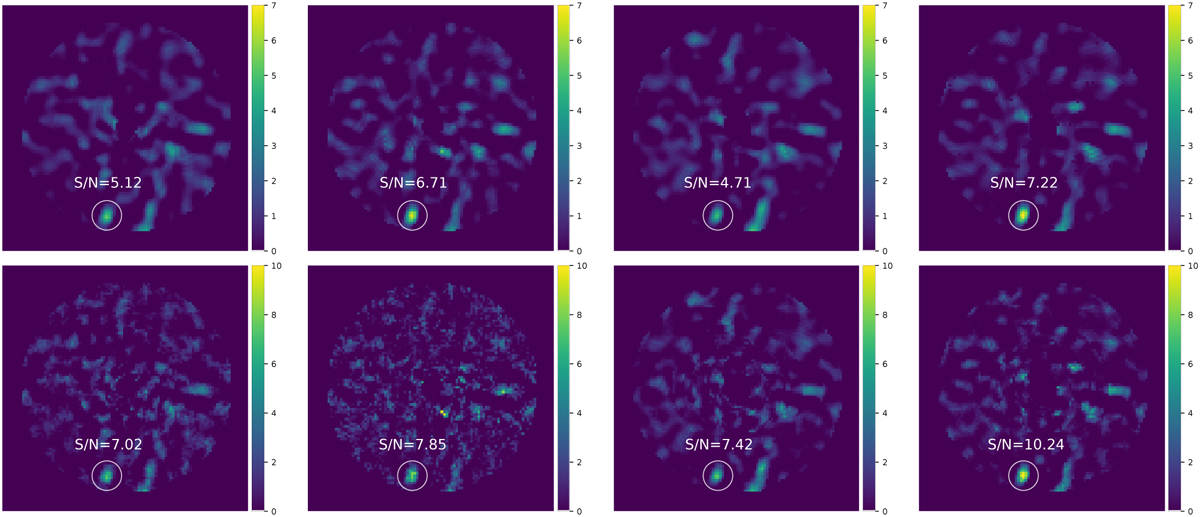
Signal-to-noise ratio maps after (from left to right) AnnPCA, AnnL1-LRA, AMATL2 , and AMATL1, respectively. Top: S/N maps calculated using VIP package. Bottom: S/N maps proposed by Bonse et al. (2023). The white circles highlight the location of the planet.
Current usage metrics show cumulative count of Article Views (full-text article views including HTML views, PDF and ePub downloads, according to the available data) and Abstracts Views on Vision4Press platform.
Data correspond to usage on the plateform after 2015. The current usage metrics is available 48-96 hours after online publication and is updated daily on week days.
Initial download of the metrics may take a while.