Fig. 4
Download original image
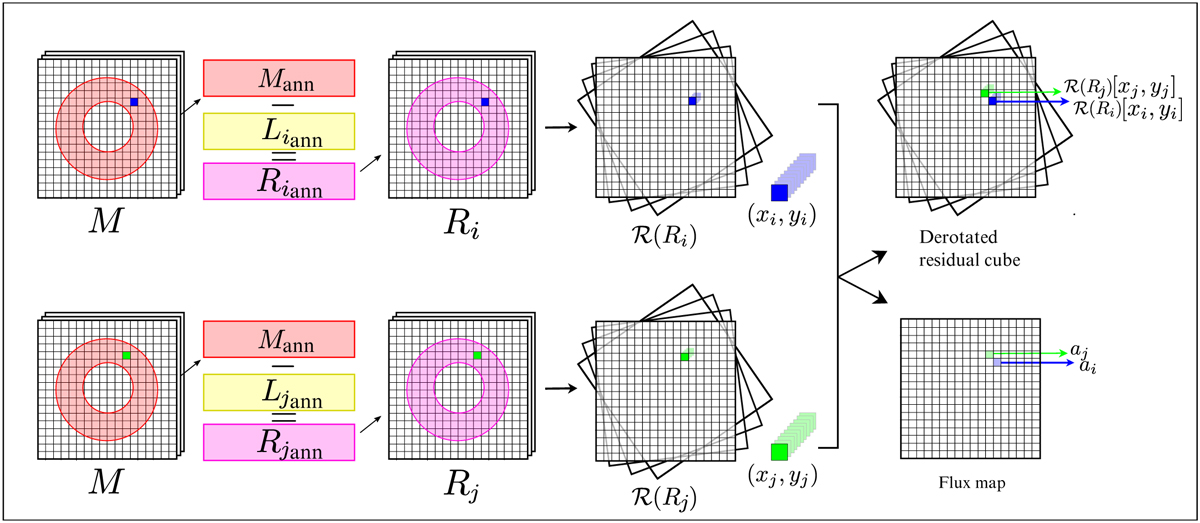
Representation of the residual cube and flux map construction. Example pixels, visualized in blue and green, have been selected from possible trajectories. For each selected pixel, a low-rank matrix is obtained, which is used to construct a residual cube and calculate a flux value. After de-rotating the residual cube, an array is produced. Combining these arrays from all possible trajectories forms the de-rotated residual cube. Similarly, flux values from all points along the possible trajectories are combined to form the flux map.
Current usage metrics show cumulative count of Article Views (full-text article views including HTML views, PDF and ePub downloads, according to the available data) and Abstracts Views on Vision4Press platform.
Data correspond to usage on the plateform after 2015. The current usage metrics is available 48-96 hours after online publication and is updated daily on week days.
Initial download of the metrics may take a while.