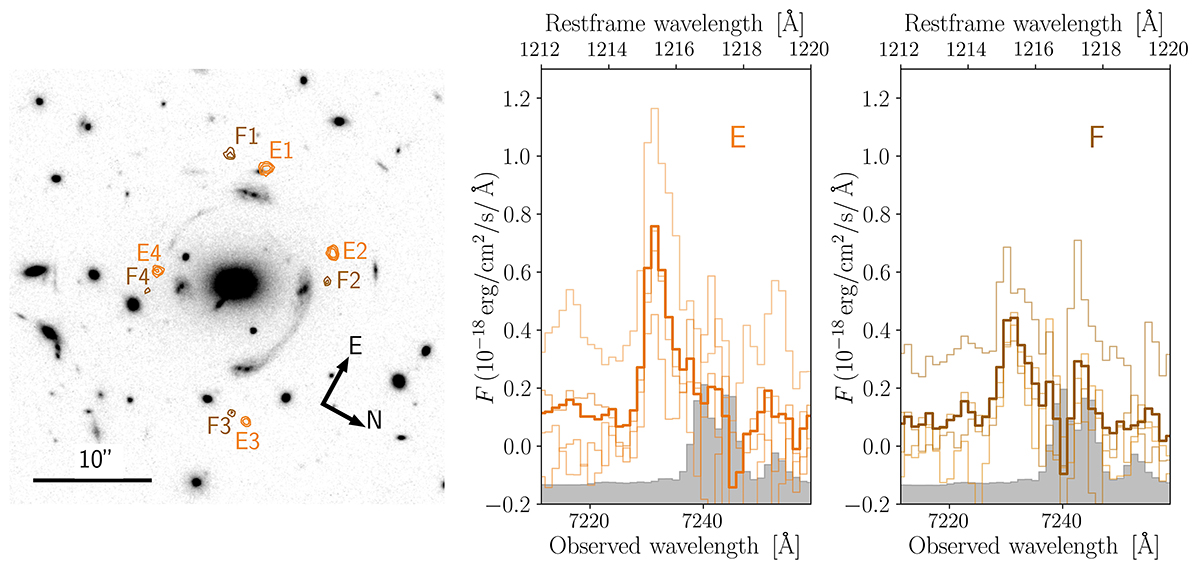
Fig. 5.
Download original image
MUSE Lyα 2D contours and 1D spectra of the multiple images of families E and F. Left: Contours from a continuum-subtracted narrow band image, centered on the emission line detected at ≈7231 Å, identified as the Lyα emission at z = 4.95. The contours are superimposed on the HST F160W image, to show that continuum counterparts are not detected. Center: Zoom-in of the MUSE 1D spectra of the multiple images E1, E2, E3, E4, and stacked (thicker line), around the detected emission line. Right: Same as in the center for F1, F2, F3, and F4. The spectra were extracted within the orange (E) and brown (F) apertures in Fig. 2, consisting of circular apertures with a radius of 0.8″, and were smoothed with a ∼2.5 Å boxcar filter.
Current usage metrics show cumulative count of Article Views (full-text article views including HTML views, PDF and ePub downloads, according to the available data) and Abstracts Views on Vision4Press platform.
Data correspond to usage on the plateform after 2015. The current usage metrics is available 48-96 hours after online publication and is updated daily on week days.
Initial download of the metrics may take a while.