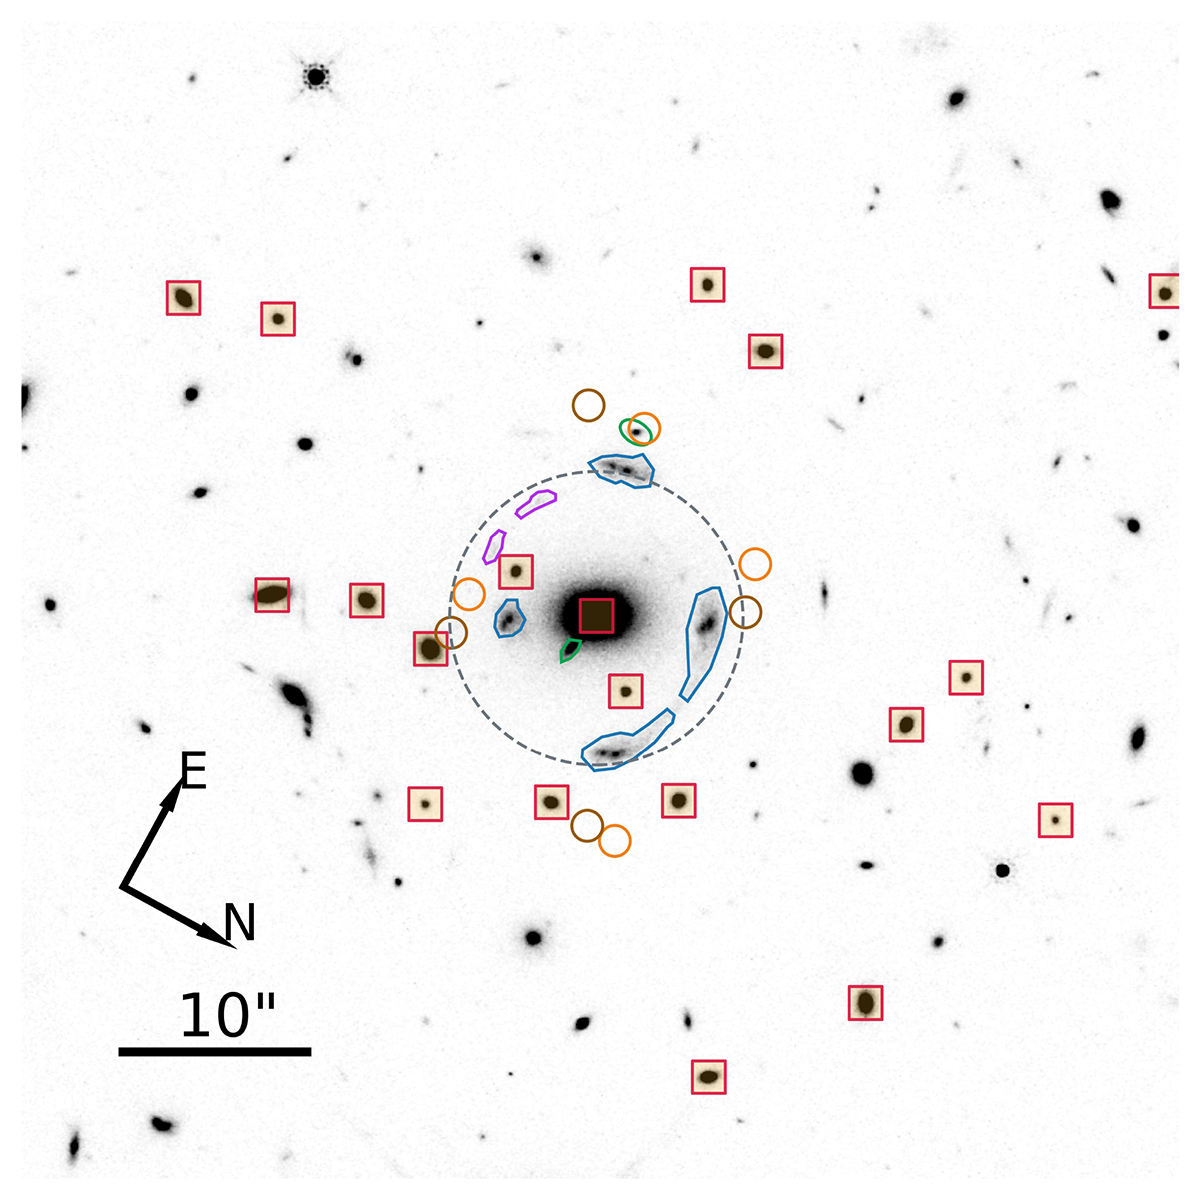
Fig. 2.
Download original image
Group members (squares) identified as those galaxies whose redshift is within 0.581 ± 0.011, equivalent to the mean redshift of the group with a spread of 2000 km s−1 (rest-frame). The colored regions represent the apertures within which we extracted the spectra of the multiple images of A and B (blue), C (green), D (purple), E (orange), and F (brown). The spectra of E and F, which do not present an HST-detected continuum, are extracted within circular apertures with a radius of 0.8″. The dashed gray curve shows a circle with a radius of 50 kpc, which represents approximately the average Einstein radius of the system.
Current usage metrics show cumulative count of Article Views (full-text article views including HTML views, PDF and ePub downloads, according to the available data) and Abstracts Views on Vision4Press platform.
Data correspond to usage on the plateform after 2015. The current usage metrics is available 48-96 hours after online publication and is updated daily on week days.
Initial download of the metrics may take a while.