Fig. 9.
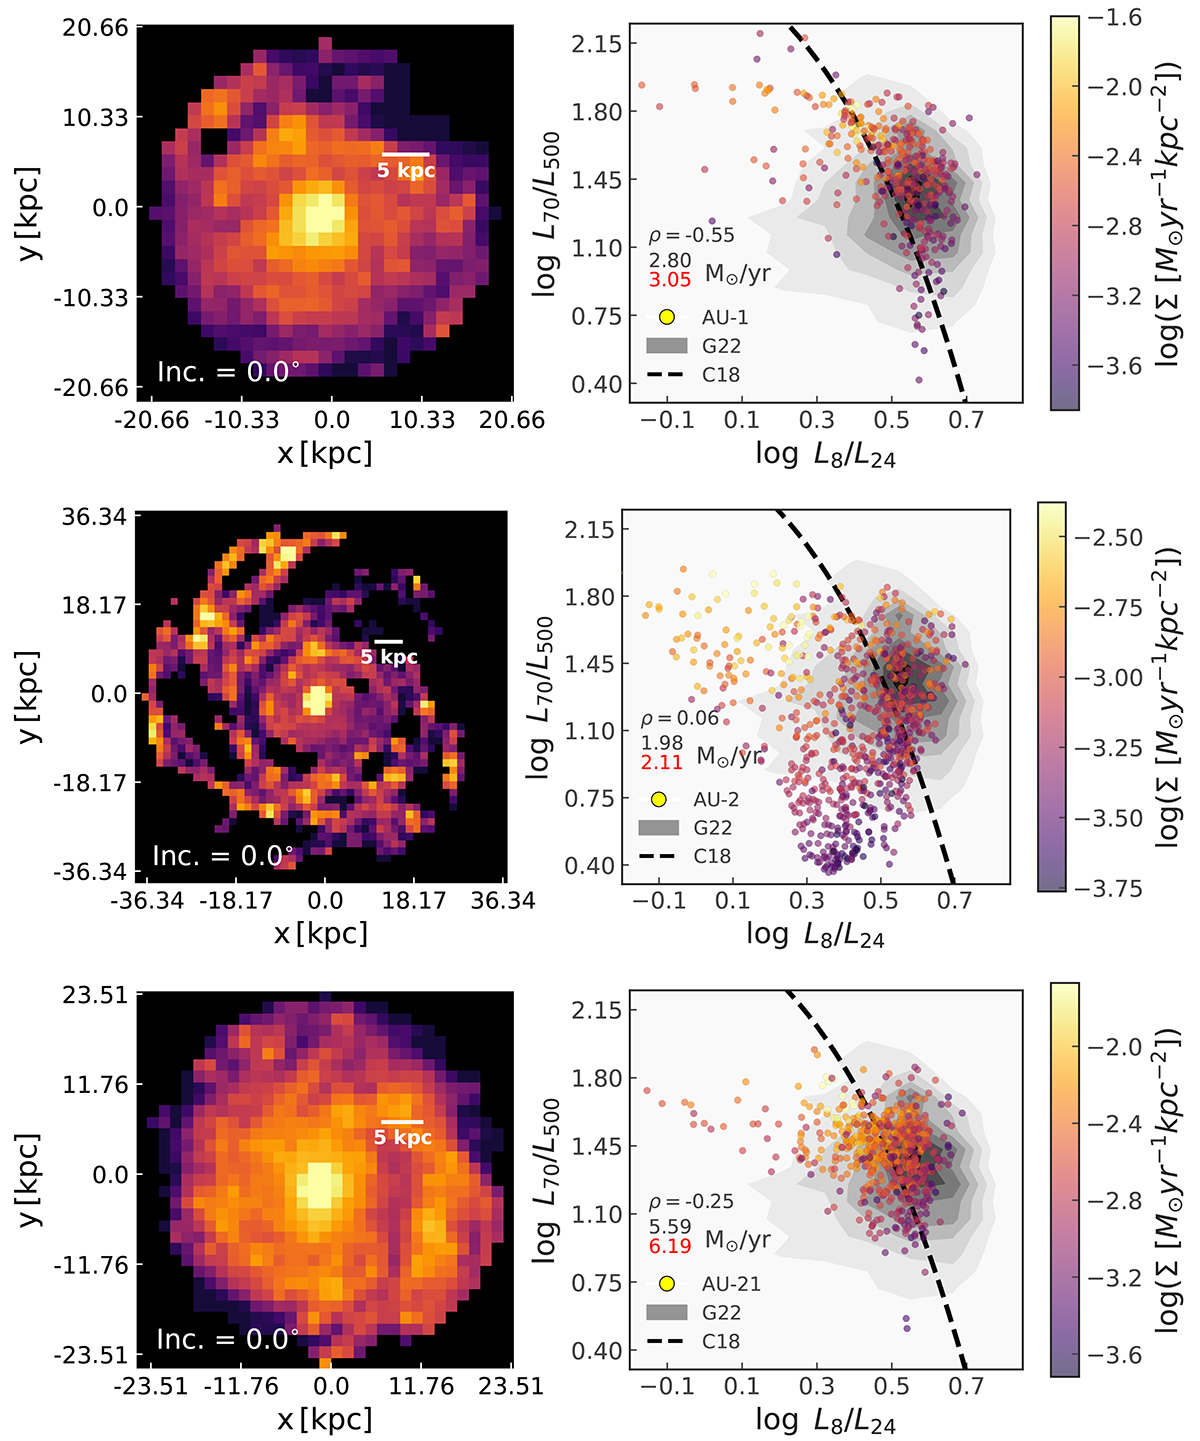
Download original image
SFRD maps (left) and associated MIR-FIR color-color relations (right) for three Auriga galaxies AU-1, AU-2, and AU-21 post-processed with TODDLERS models. The figures in the right column also indicate the PCC value, the SFR of the galaxy inferred using the calibration given in L11 (black value; see Sect. 5.2.1), and the true SFR of the galaxies averaged over 100 Myr (red value). The gray filled contours represent the colors of the KINGFISH sample as reported by G22 while the dashed curve is the relation for NGC-4449 given in C22.
Current usage metrics show cumulative count of Article Views (full-text article views including HTML views, PDF and ePub downloads, according to the available data) and Abstracts Views on Vision4Press platform.
Data correspond to usage on the plateform after 2015. The current usage metrics is available 48-96 hours after online publication and is updated daily on week days.
Initial download of the metrics may take a while.