Open Access
Fig. 7.
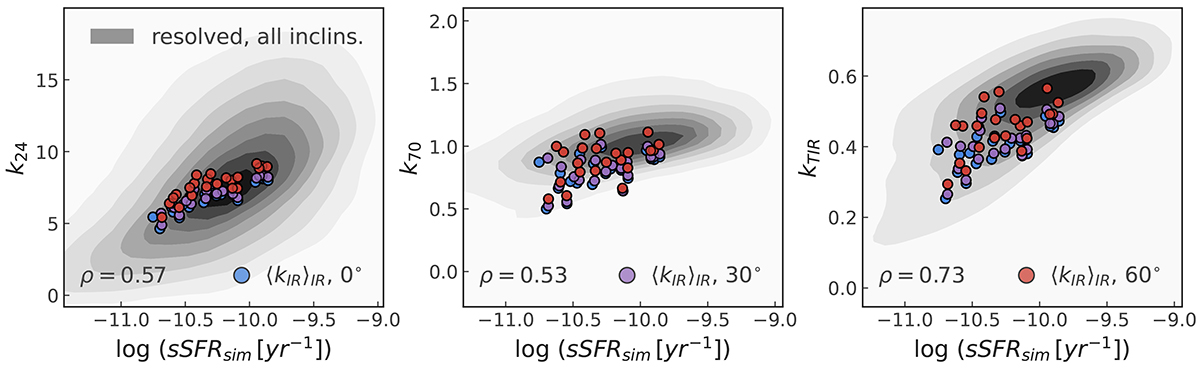
Download original image
Spatially varying IR correction factor, kIR, shown as a function of the projected sSFR for the Auriga-D sub-sample using the three face-on inclinations. The circular points represent the light-weighted values for individual galaxies at the three inclinations considered in this work.
Current usage metrics show cumulative count of Article Views (full-text article views including HTML views, PDF and ePub downloads, according to the available data) and Abstracts Views on Vision4Press platform.
Data correspond to usage on the plateform after 2015. The current usage metrics is available 48-96 hours after online publication and is updated daily on week days.
Initial download of the metrics may take a while.