Open Access
Fig. 3.
Download original image
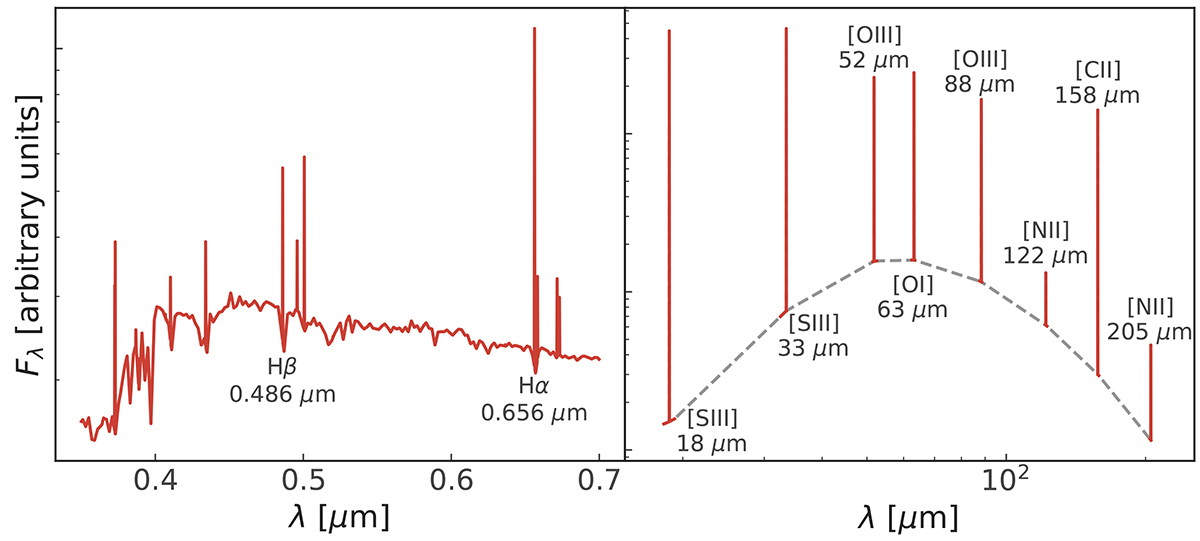
Observables generated for the line-emission-based analysis carried out in this work. Left: Spectrum at a resolution R = 3000 in the optical 0.4 − 0.7 μm, right: Selected windows for lines in the FIR, again at R = 3000. At each of these wavelengths, we also generate images at a spatial resolution of 0.5 kpc.
Current usage metrics show cumulative count of Article Views (full-text article views including HTML views, PDF and ePub downloads, according to the available data) and Abstracts Views on Vision4Press platform.
Data correspond to usage on the plateform after 2015. The current usage metrics is available 48-96 hours after online publication and is updated daily on week days.
Initial download of the metrics may take a while.