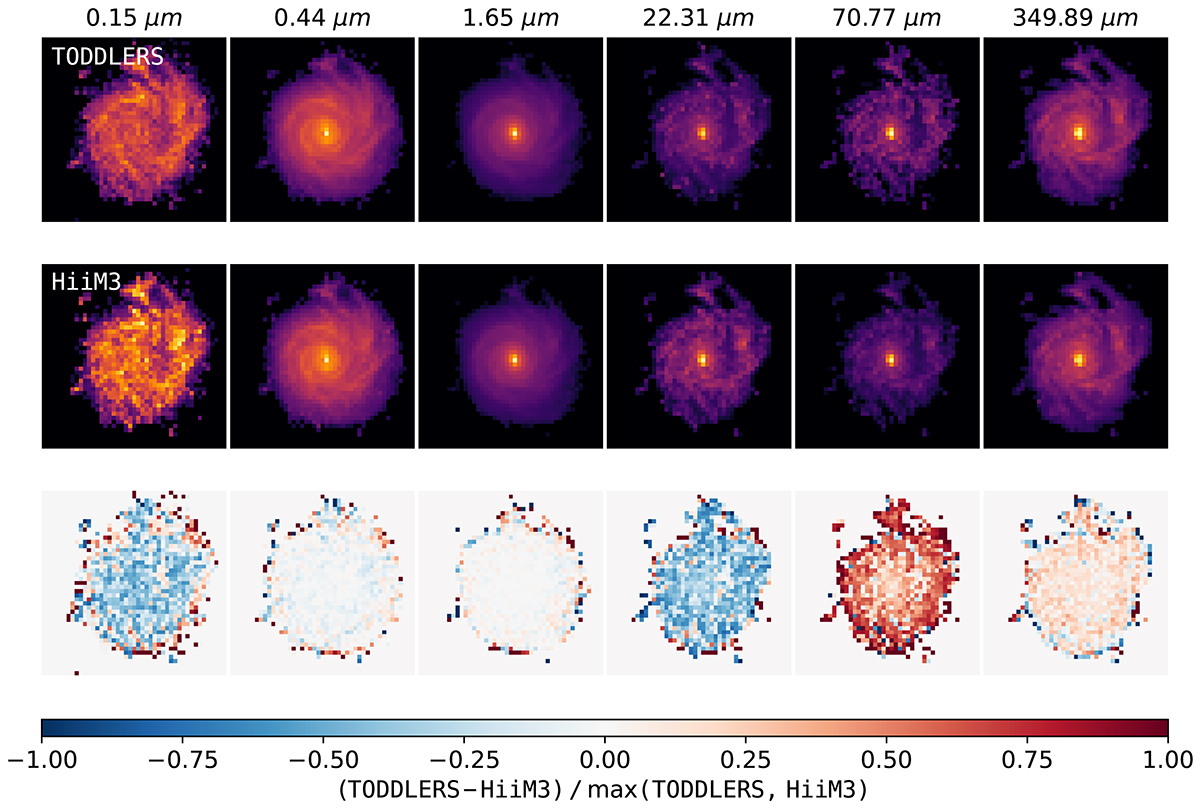
Fig. C.1.
Download original image
Comparison of spatial maps generated by SKIRT for TODDLERS (top row), HiiM3 (middle row) models of AU-21, and the normalized difference between the two (bottom row). Columns show different bands centered at wavelengths listed on top. Images use a cube root scale. For each band, the images for both models share the same colormap limits, but the colormap limits may vary between bands. The data has been smoothed using a uniform filter of three pixels.
Current usage metrics show cumulative count of Article Views (full-text article views including HTML views, PDF and ePub downloads, according to the available data) and Abstracts Views on Vision4Press platform.
Data correspond to usage on the plateform after 2015. The current usage metrics is available 48-96 hours after online publication and is updated daily on week days.
Initial download of the metrics may take a while.