Fig. 18.
Download original image
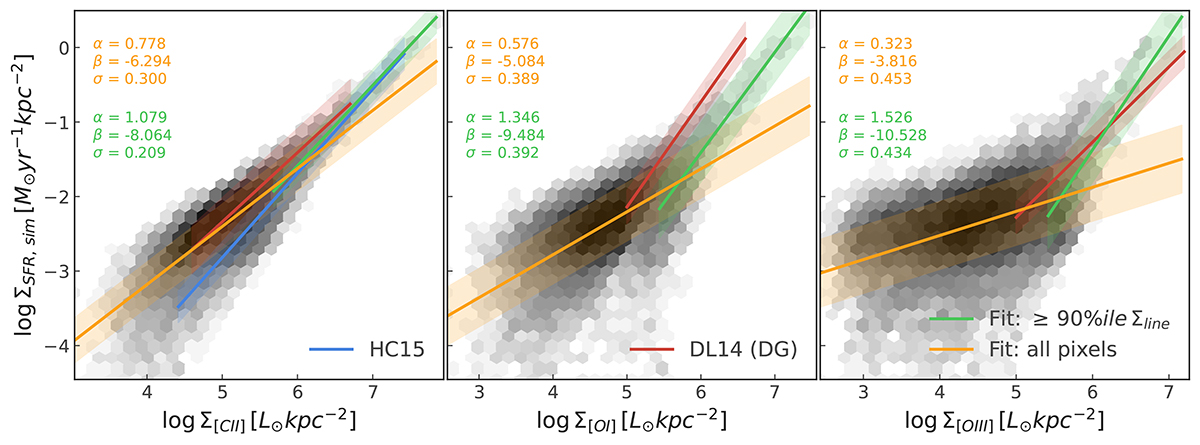
Linear fits in the log-log space obtained using the line-emission for Auriga galaxies based on Eq. (10). The shaded area signifies the 1σ dispersion of the fits. The orange fits uses all the pixels, while the green ones only use the brightest 10% of pixels out of the entire Auriga sample for each line. The observational fits for metal-poor dwarf galaxies reported in DL14 are shown in red while those for the [C II] line reported in HC15 are shown in blue. The filled areas represent the 1σ dispersion on the various fits.
Current usage metrics show cumulative count of Article Views (full-text article views including HTML views, PDF and ePub downloads, according to the available data) and Abstracts Views on Vision4Press platform.
Data correspond to usage on the plateform after 2015. The current usage metrics is available 48-96 hours after online publication and is updated daily on week days.
Initial download of the metrics may take a while.