Fig. 17.
Download original image
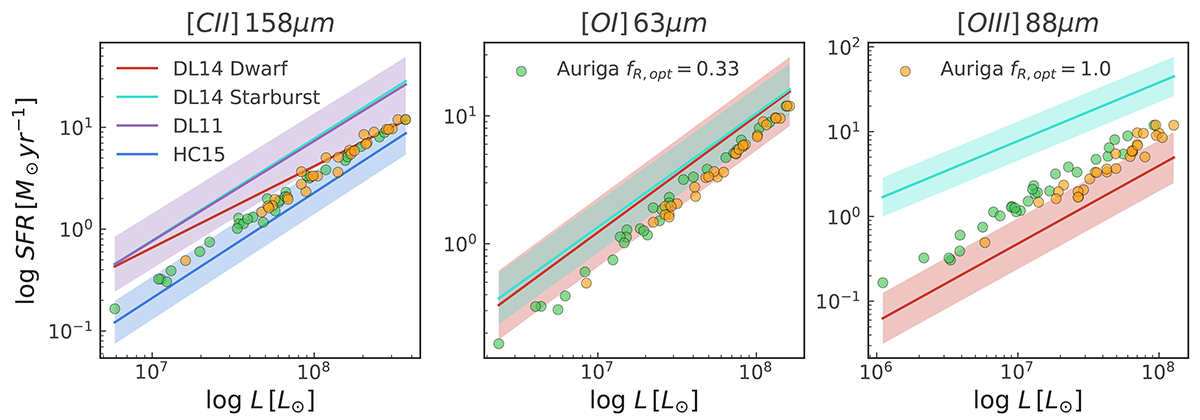
Line luminosity vs. SFR relation for the Auriga galaxies post-processed with the TODDLERS library. The SFR for the Auriga galaxies is the simulation reported value averaged over 30 Myr. The orange points represent values using an aperture (see Sect. 5.2.1) fR, opt = 1, while the green ones are for fR, opt = 0.33. The straight lines represent various observational relations and the associated filled areas represent the 1σ dispersion on the calibration.
Current usage metrics show cumulative count of Article Views (full-text article views including HTML views, PDF and ePub downloads, according to the available data) and Abstracts Views on Vision4Press platform.
Data correspond to usage on the plateform after 2015. The current usage metrics is available 48-96 hours after online publication and is updated daily on week days.
Initial download of the metrics may take a while.