Fig. 14.
Download original image
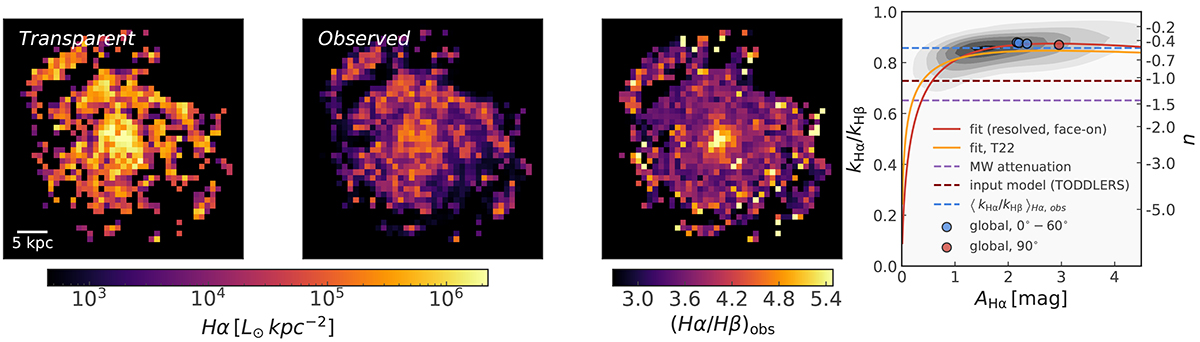
Hα maps and attenuation law for one of the Auriga galaxies, AU-1. Panel 1: Transparent Hα surface density, Panel 2: Observed Hα surface density, Panel 3: The observed Balmer decrement, and Panel 4: The attenuation law found by inverting Eq. (7), also shown is the fit to the attenuation law for a simulated Milky-Way galaxy done in T22 (orange) and the fit to the resolved face-on data obtained in this work.
Current usage metrics show cumulative count of Article Views (full-text article views including HTML views, PDF and ePub downloads, according to the available data) and Abstracts Views on Vision4Press platform.
Data correspond to usage on the plateform after 2015. The current usage metrics is available 48-96 hours after online publication and is updated daily on week days.
Initial download of the metrics may take a while.