Fig. 11.
Download original image
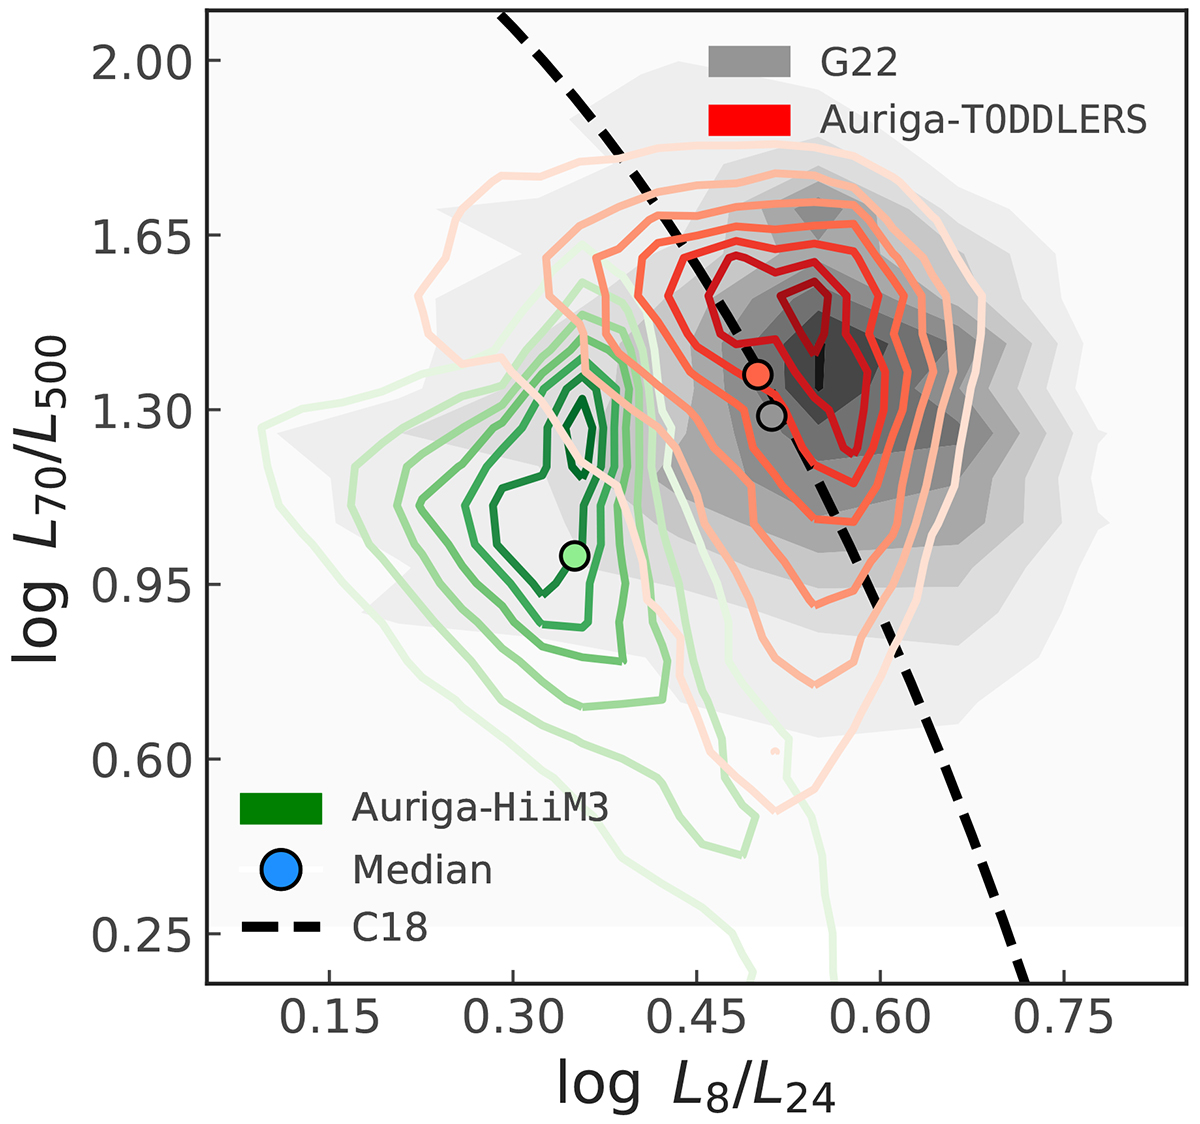
MIR-FIR color-color diagram considering all the pixels of the Auriga-D galaxies at inclinations 0°, 30°, and 60° along with consolidated “Regime-1” and “Regime-2” data from G22 (gray region). The orange contours represent the data when TODDLERS library is employed, while the green contours are obtained in the case of HiiM3. The darkness of the contour colors represents the density of the pixels on a linear scale. Also shown are the median values for each of the three datasets using round markers of corresponding colors. The dashed black curve is the relation obtained in C18.
Current usage metrics show cumulative count of Article Views (full-text article views including HTML views, PDF and ePub downloads, according to the available data) and Abstracts Views on Vision4Press platform.
Data correspond to usage on the plateform after 2015. The current usage metrics is available 48-96 hours after online publication and is updated daily on week days.
Initial download of the metrics may take a while.