Fig. 10.
Download original image
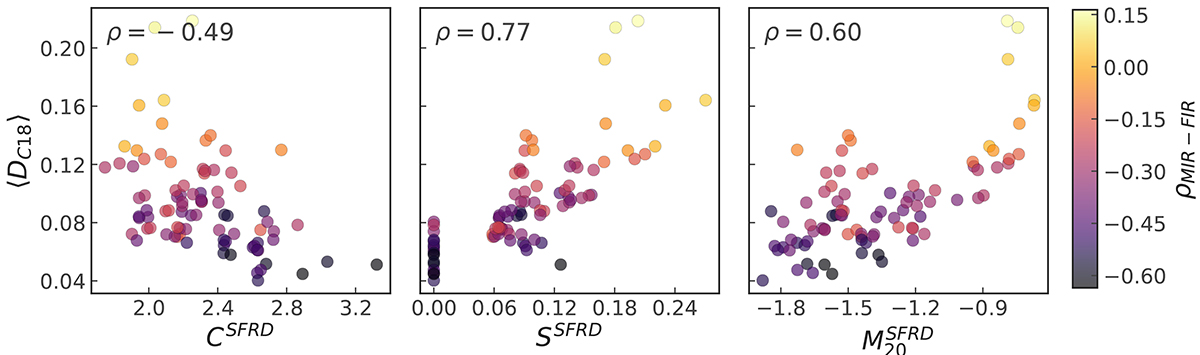
Dispersion in Auriga galaxies’ MIR-FIR color-color plot as a function of the non-parametric indicators of galaxy morphology applied to the SFRD maps. The data includes all the three inclinations and all Auriga galaxies except AU-11, which is undergoing a merger. The data-points are color-coded using the Pearson correlation coefficient obtained for the color-color relation for individual galaxies.
Current usage metrics show cumulative count of Article Views (full-text article views including HTML views, PDF and ePub downloads, according to the available data) and Abstracts Views on Vision4Press platform.
Data correspond to usage on the plateform after 2015. The current usage metrics is available 48-96 hours after online publication and is updated daily on week days.
Initial download of the metrics may take a while.