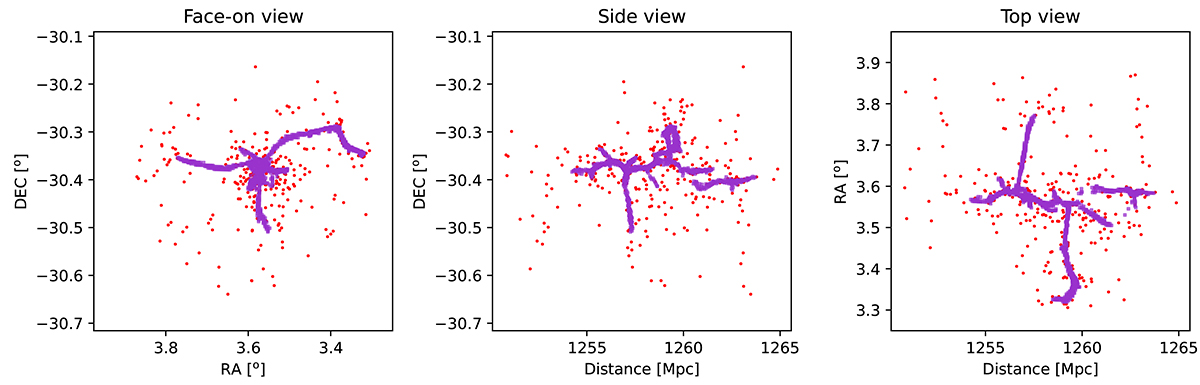
Fig. 6.
Download original image
3D distribution of galaxies (red points) in A2744, superimposed to the 3D probability map of the filamentary structures obtained with T-REx on the galaxy data. Only voxels with probability larger than 0.1 are shown. Left: Projection along the LoS. The middle and right panels show side and top view projections, perpendicular to the LoS.
Current usage metrics show cumulative count of Article Views (full-text article views including HTML views, PDF and ePub downloads, according to the available data) and Abstracts Views on Vision4Press platform.
Data correspond to usage on the plateform after 2015. The current usage metrics is available 48-96 hours after online publication and is updated daily on week days.
Initial download of the metrics may take a while.