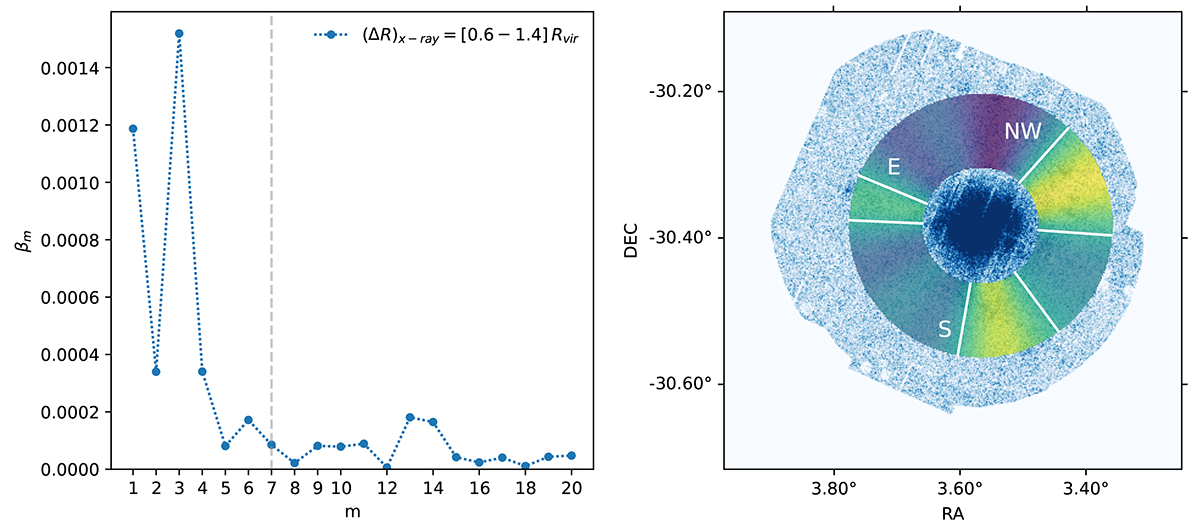
Fig. 2.
Download original image
Results of the multipole analysis of the X-ray data, in one radial aperture (ΔR)X-ray = [0.6, 1.4] Rvir. Left panel: Distribution of the multipolar ratio βm as a function of multipole order m. The limit order for the reconstruction, mmax, rec = 7, is shown as a vertical line. Right panel: Reconstructed map in the aperture (ΔR)X-ray. The white contours represent the threshold of 60% of the map maximum and identify the relevant filamentary structures, as described in the text. For reference, the X-ray hit-map is shown in the background.
Current usage metrics show cumulative count of Article Views (full-text article views including HTML views, PDF and ePub downloads, according to the available data) and Abstracts Views on Vision4Press platform.
Data correspond to usage on the plateform after 2015. The current usage metrics is available 48-96 hours after online publication and is updated daily on week days.
Initial download of the metrics may take a while.