Fig. A.1
Download original image
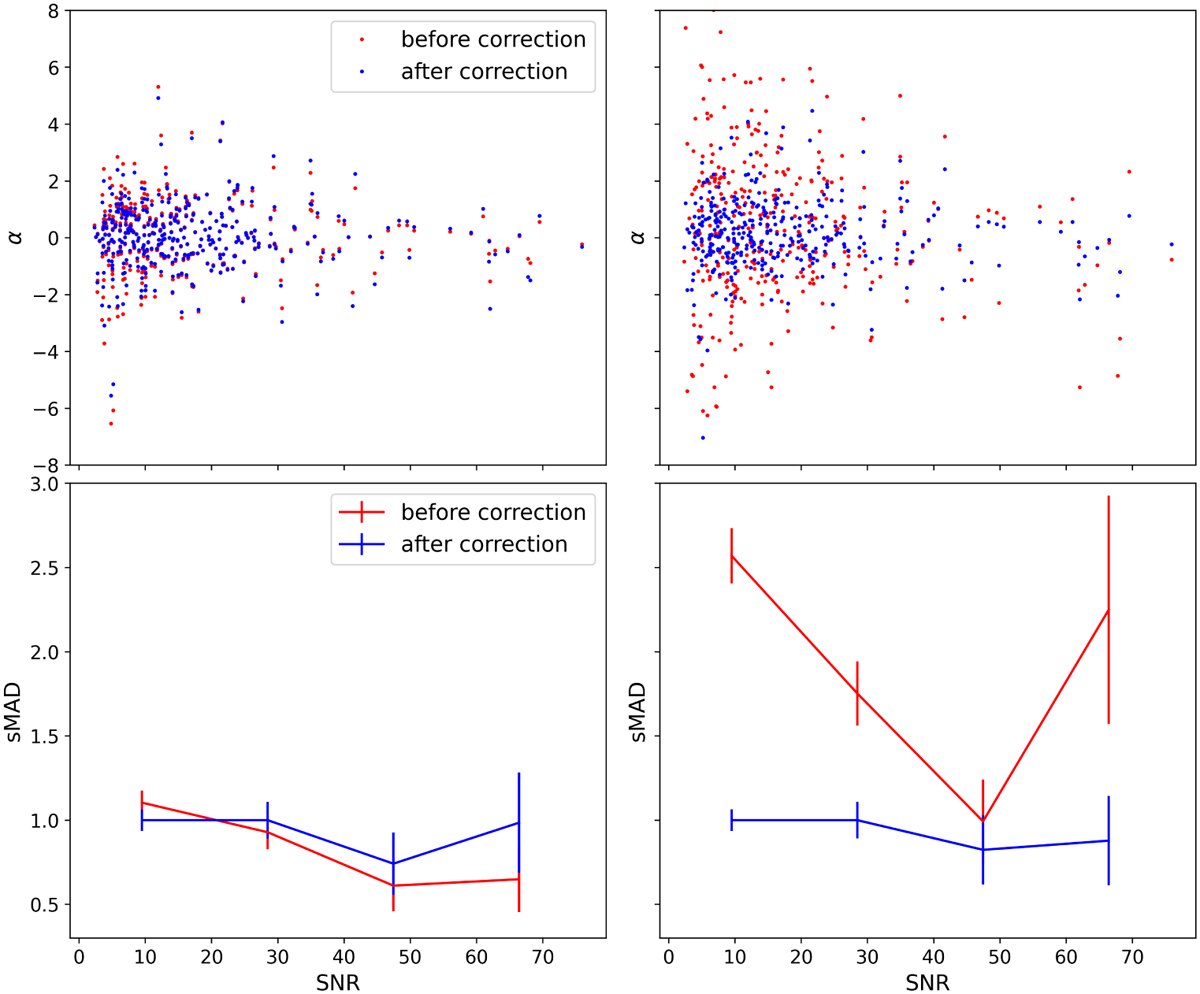
Upper panels: distribution of values of α as a function of the minimum S/N between the pair of velocities compared. In red, we show the values before the uncertainty correction and in blue after it, as indicated in the label. Left panel: CC velocities and uncertainties. Right panel: MLM velocities and uncertainties. Lower panels: sMAD of the α parameter distribution at different bins of S/N. In red, we show the values before the uncertainty correction and in blue after it, as indicated in the label. Left panel: CC velocities and uncertainties. Right panel: MLM velocities and uncertainties.
Current usage metrics show cumulative count of Article Views (full-text article views including HTML views, PDF and ePub downloads, according to the available data) and Abstracts Views on Vision4Press platform.
Data correspond to usage on the plateform after 2015. The current usage metrics is available 48-96 hours after online publication and is updated daily on week days.
Initial download of the metrics may take a while.