Fig. 2
Download original image
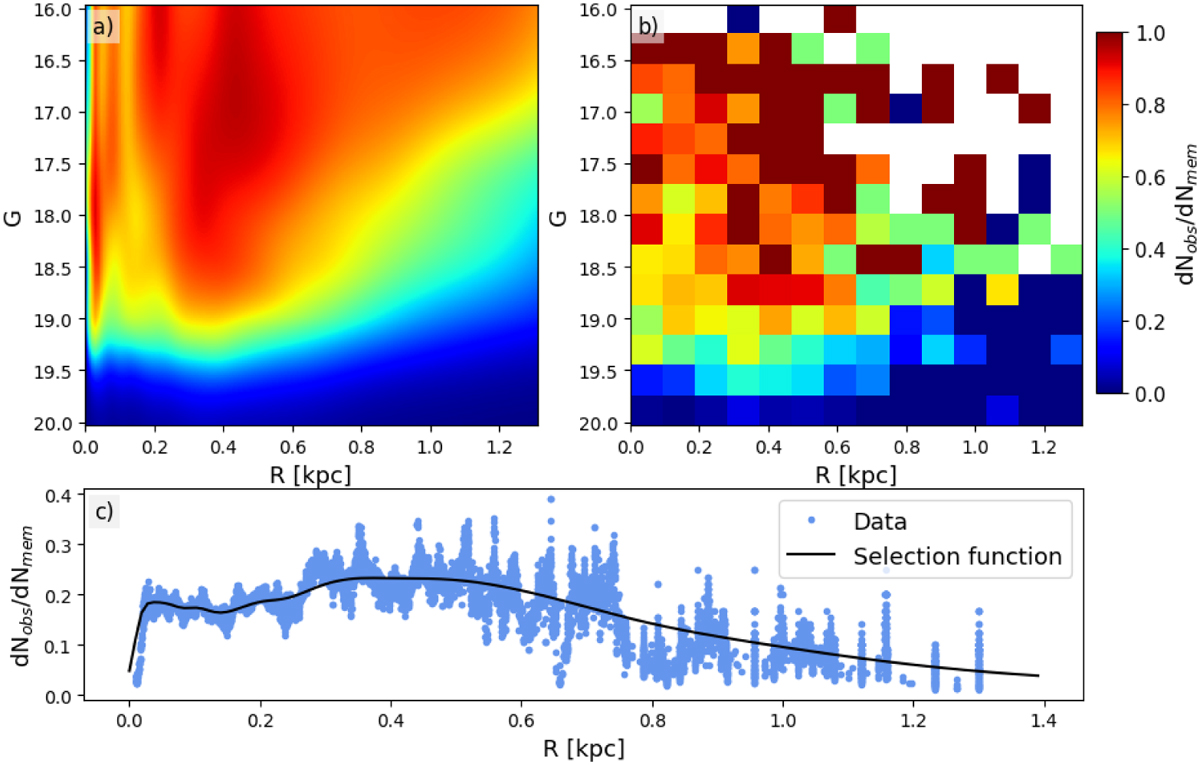
Selection function of the dataset. Panel a) shows the continuous selection function used in this work and defined in Eq. (2); panel b) shows the ratio between spectroscopically observed and astrometric member stars for a 15×15 gird in the (R, G) plane. Panel c) shows the selection function integrated over all magnitudes (Eq. (3)) as a solid line and the ratio between observed and member stars for 100 different grids of binning in R.
Current usage metrics show cumulative count of Article Views (full-text article views including HTML views, PDF and ePub downloads, according to the available data) and Abstracts Views on Vision4Press platform.
Data correspond to usage on the plateform after 2015. The current usage metrics is available 48-96 hours after online publication and is updated daily on week days.
Initial download of the metrics may take a while.