Fig. 9
Download original image
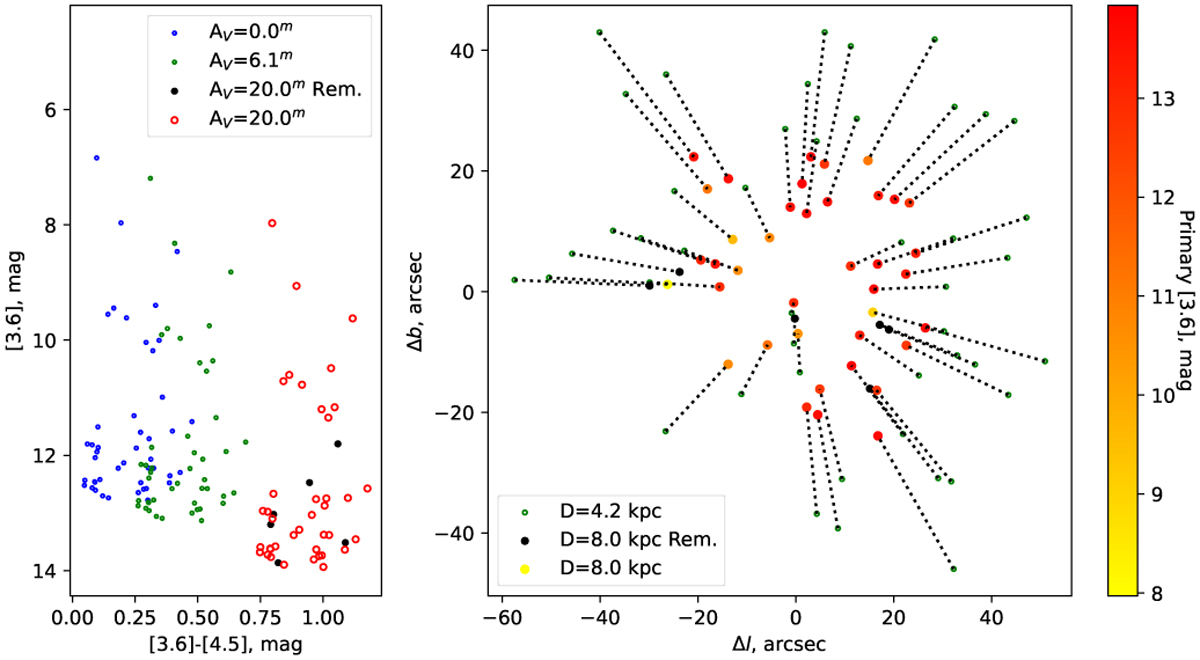
Example of constructing an artificial cluster out of the “pure” Westerlund 2 population. The CMD is shown in the left panel. The green points mark the apparent position of the member stars as they are in Westerlund 2, the blue points indicate correction for reddening, and the red points reflect the additional reddening to the newly inserted artificial cluster. The distance modulus change was not applied here. The right panel shows the change in the apparent position of the member stars as they are “moved” from the distance of Westerlund 2 further out to the distance of the new artificial cluster. Black points on both panels are stars that were removed or merged because they came closer than the adopted limit to other stars that are brighter than them. For details, see Sect. 3.1.
Current usage metrics show cumulative count of Article Views (full-text article views including HTML views, PDF and ePub downloads, according to the available data) and Abstracts Views on Vision4Press platform.
Data correspond to usage on the plateform after 2015. The current usage metrics is available 48-96 hours after online publication and is updated daily on week days.
Initial download of the metrics may take a while.