Fig. 8
Download original image
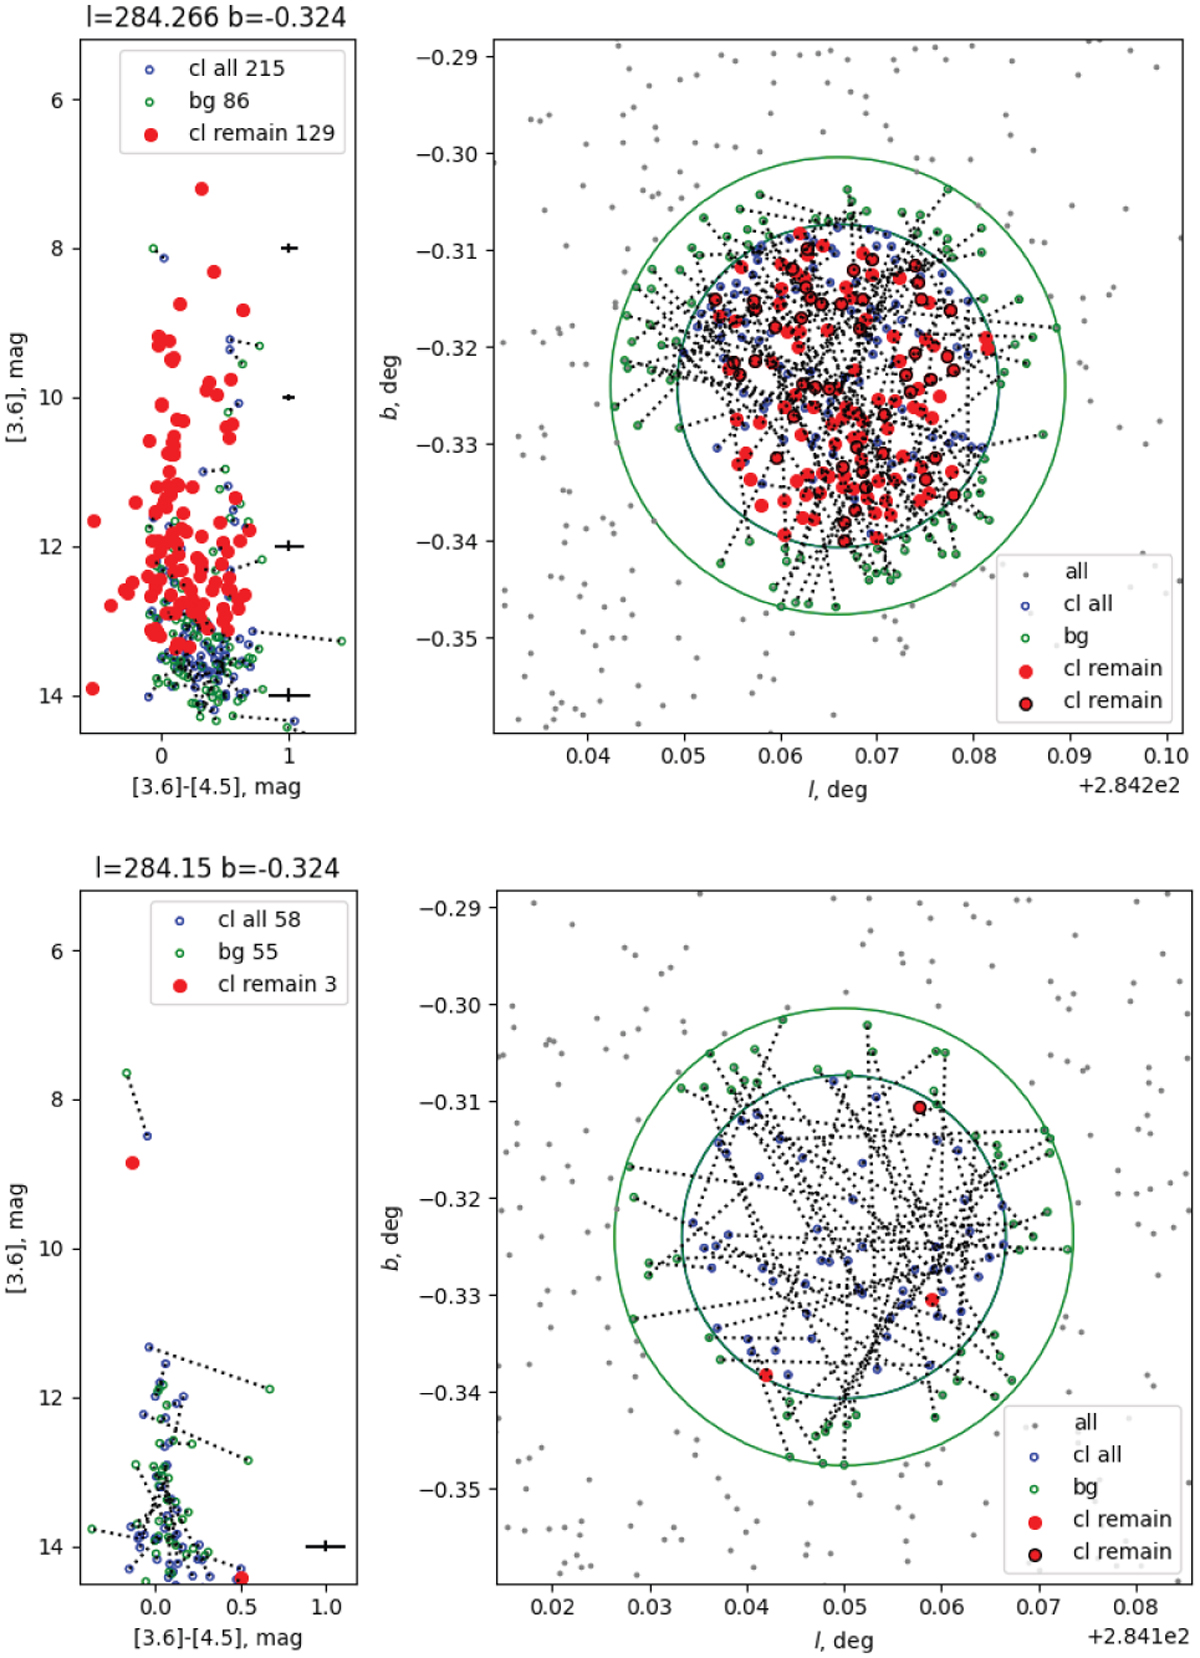
Example of statistical decontamination of the cluster Westerlund 2 region (top) and an empty field nearby (bottom), shown to verify the removal procedure. The galactic coordinates of the two regions are marked at the top. The left panels show the GLIMPSE CMDs and the right ones the maps. The blue circles are all sources within the cluster radius (adopted 1′), the green circles all sources in an adjustment circular annulus (marked with green lines) with the same area as the cluster region, and the gray dots all sources outside both these two regions. The dotted black lines connect each removed cluster star with the corresponding field star. Solid red dots mark the remaining clusters of stars. The numbers in the legend give the number of each type of object.
Current usage metrics show cumulative count of Article Views (full-text article views including HTML views, PDF and ePub downloads, according to the available data) and Abstracts Views on Vision4Press platform.
Data correspond to usage on the plateform after 2015. The current usage metrics is available 48-96 hours after online publication and is updated daily on week days.
Initial download of the metrics may take a while.