Fig. 2
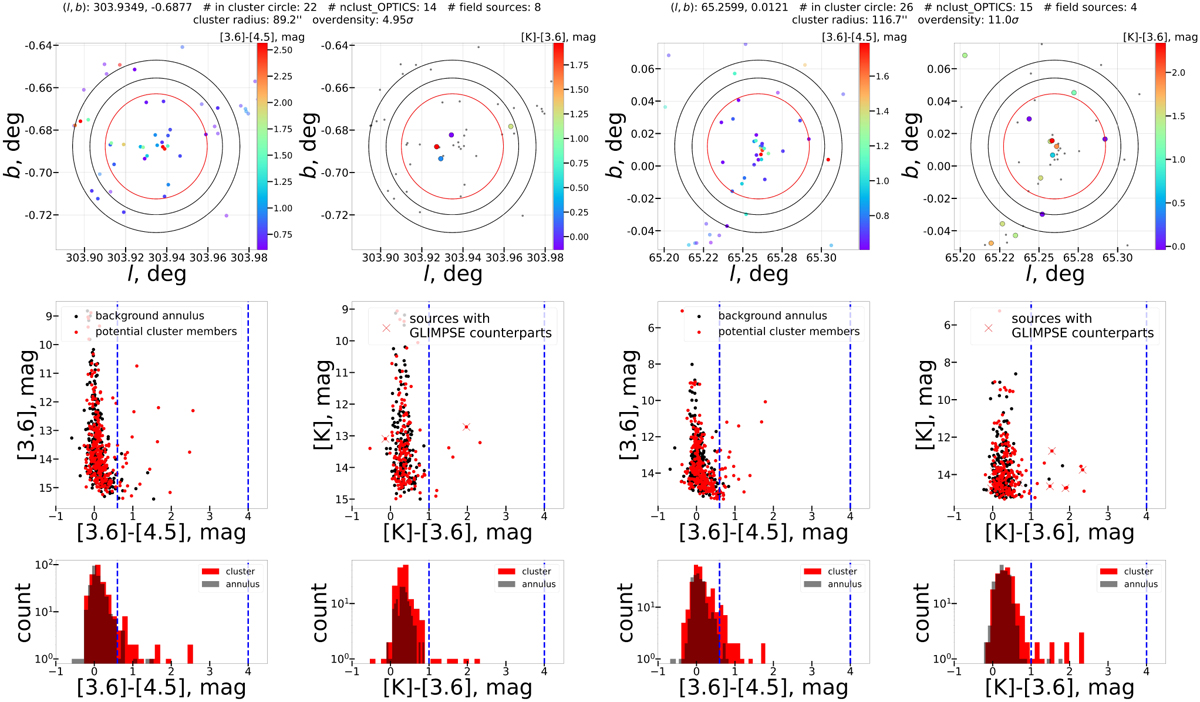
Download original image
Cluster candidate verification plots for a known recovered cluster (G3CC 8; Morales et al. 2013, left) and for a new candidate (right). The titles list the derived cluster parameters (see Sects. 2.3 and 3 for more details). Panels: Top left – Mid-IR CMD; red dots are all sources within the cluster radius and black dots are all sources in the sky annulus. Top right – Map of GLIMPSE sources with colors in the bin 0.6 mag≤[3.6]−[4.5]≤4.0 mag, color-coded by [3.6]−[4.5]. The red circle shows the cluster region and the black rings the sky annulus. Middle left – Combined near/mid-IR CMD; the dots are coded lines in the panel above. Middle right – Map of GLIMPSE-2MASS sources. Black dots represent all sources, while larger dots color-coded by [K]−[3.6] are the objects with 0.6 mag≤[3.6]−[4.5]≤4.0 mag. Bottom left – Mid-IR [3.6]−[4.5] color histogram for sources in the cluster region (black) and sources in the background annulus (red). The potential cluster members cause the excess at 0.6 mag≤[3.6]−[4.5]≤4.0 mag. Bottom right – Near/mid-IR K-[3.6] color histogram. The notation is the same as on the previous histogram. Vertical dashed blue lines at K−[4.5]=1.0 mag and 4.0 mag were added only to guide the eye. The potential cluster members cause the excess at K−[4.5]≥1.0 mag.
Current usage metrics show cumulative count of Article Views (full-text article views including HTML views, PDF and ePub downloads, according to the available data) and Abstracts Views on Vision4Press platform.
Data correspond to usage on the plateform after 2015. The current usage metrics is available 48-96 hours after online publication and is updated daily on week days.
Initial download of the metrics may take a while.