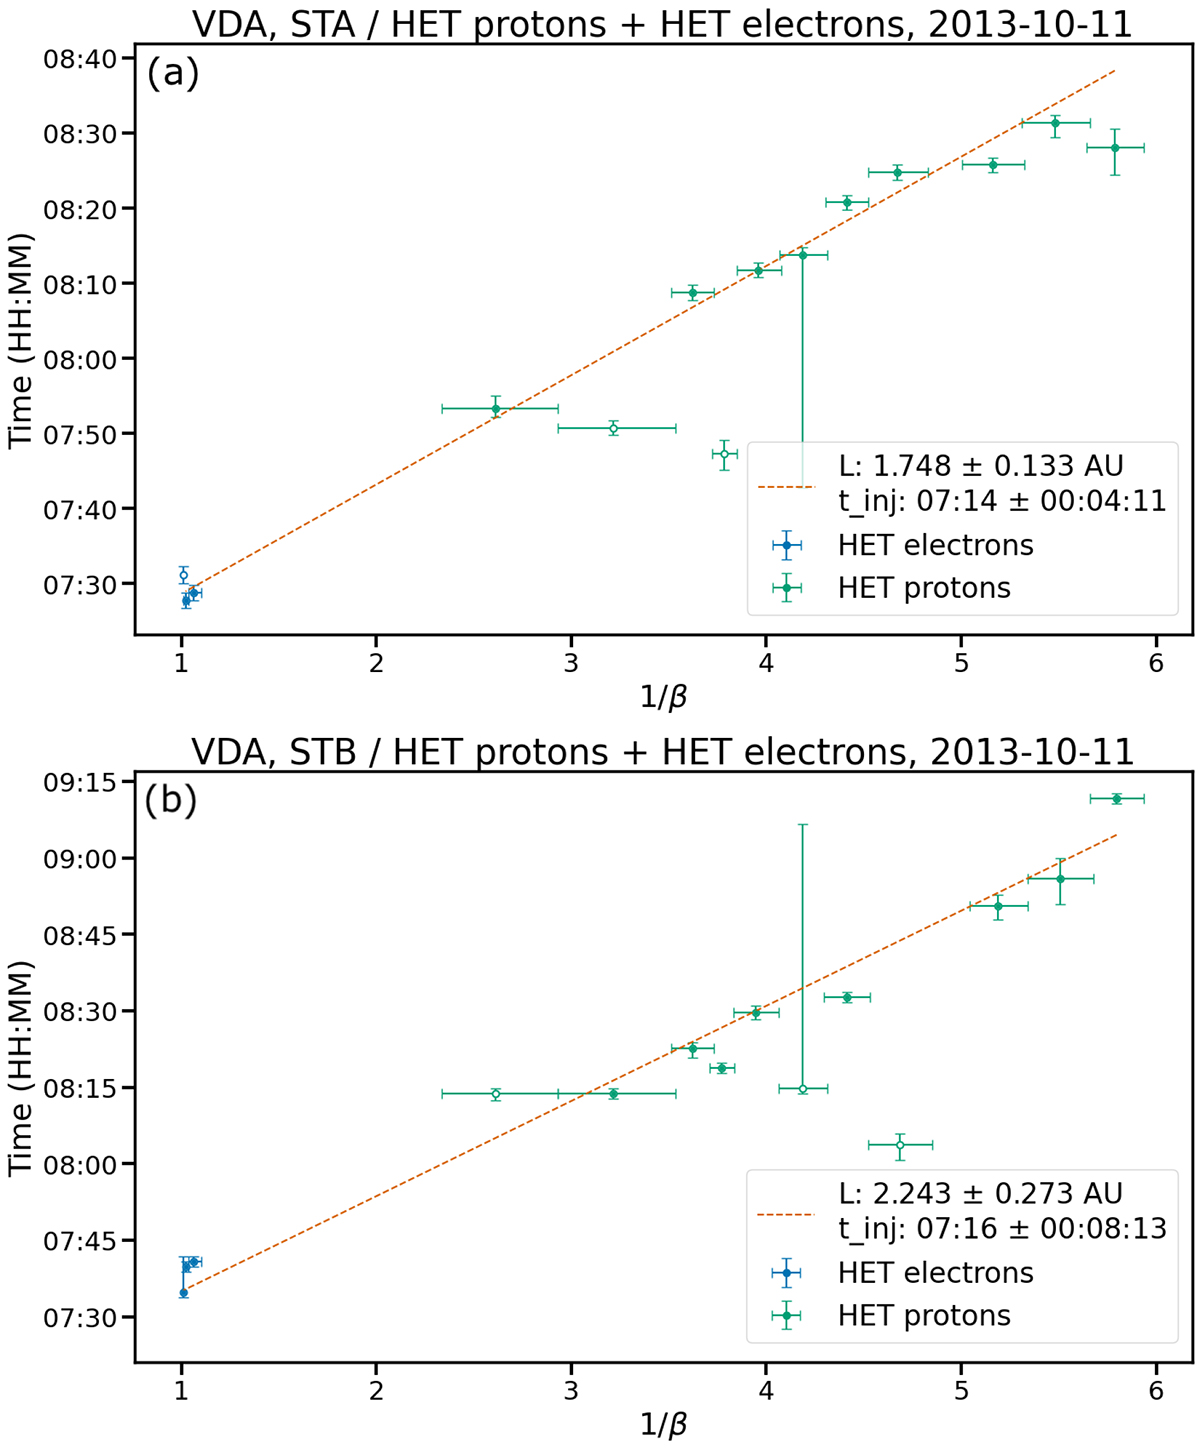
Fig. 7.
Download original image
Velocity dispersion analysis (VDA) for the 11 October 2013 event. For each panel, observational time is in HH:MM format as a function of 1/β, the plasma parameter (see text for more details). Panel (a): VDA for STEREO-A. Panel (b): VDA for STEREO-B. The blue points correspond to electrons and the green points to protons. Only the filled circles are included in the fit (dashed red line).
Current usage metrics show cumulative count of Article Views (full-text article views including HTML views, PDF and ePub downloads, according to the available data) and Abstracts Views on Vision4Press platform.
Data correspond to usage on the plateform after 2015. The current usage metrics is available 48-96 hours after online publication and is updated daily on week days.
Initial download of the metrics may take a while.