Fig. 5.
Download original image
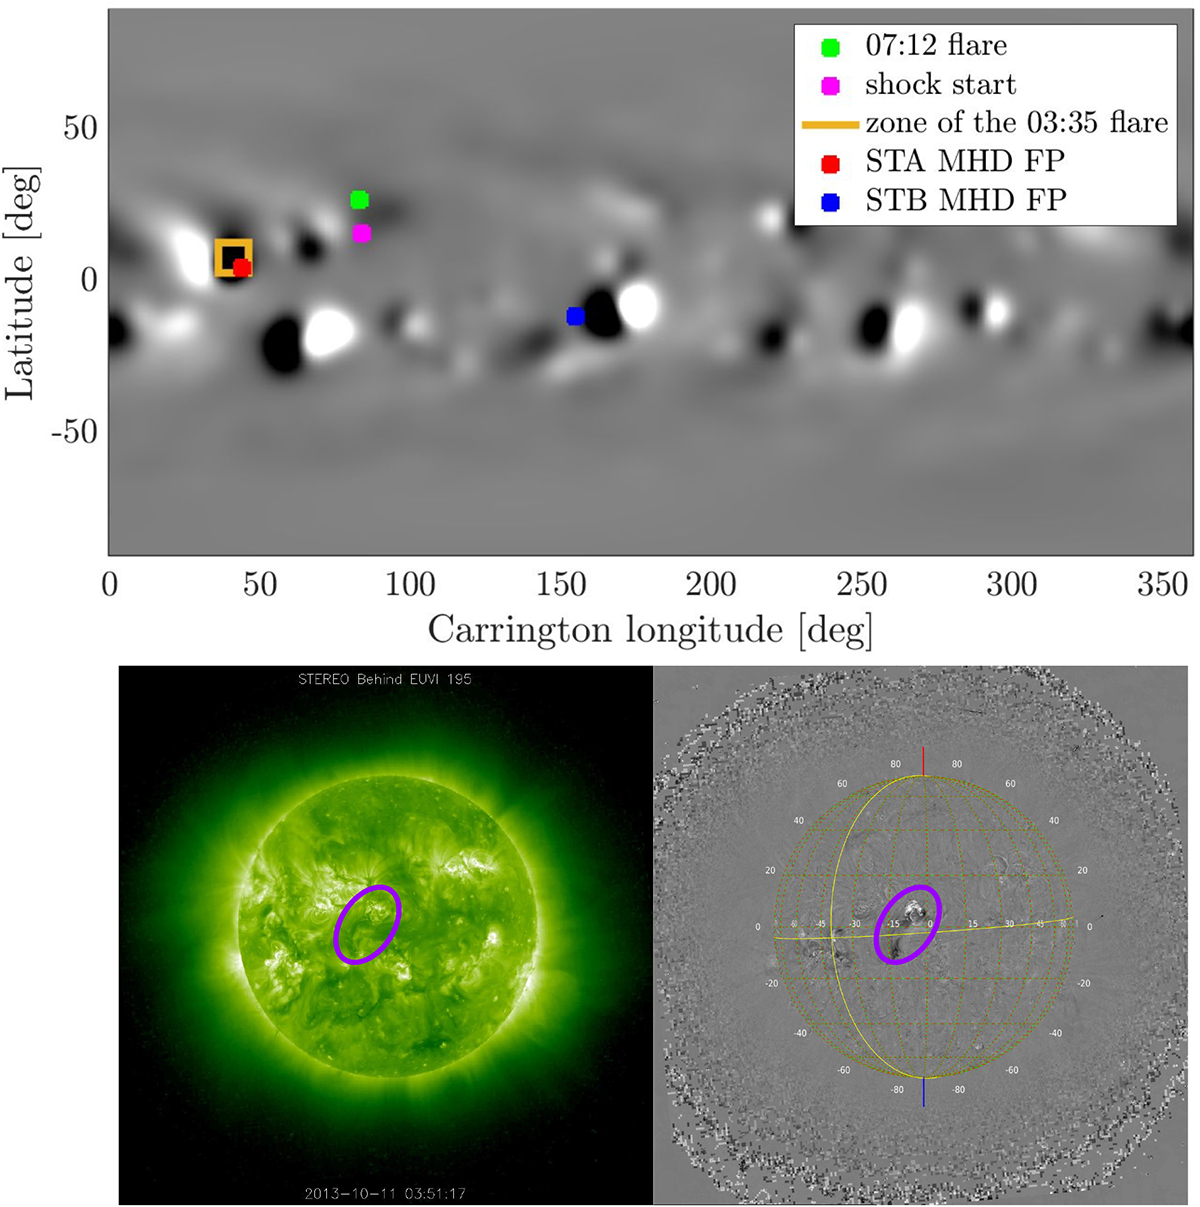
Location on the solar surface of the various elements involved in the 11 October 2013 event. First panel: Representation of the solar magnetogram of Carrington rotation 2143, for a MHD cube. The colour is given according to the magnetic field value from the cubes. The green dot indicates the location of the flare, whereas the pink dot indicates the projected position of the shock ‘nose’ at its first reconstruction. The yellow square indicates the location with uncertainties of a flare occurring at 03:35 ± 00:05am which could have influenced the SEP event received by STA. The red and blue dots represents respectively the STA and STB footpoints obtained for MHD cubes (see text for more information). Second panel: Image in EUVI 195 from STEREO-B, at 03:51:17 UTC (left) and integrated through 03:00 UTC and 04:00 UTC (right). The purple ellipsoid indicates the zone of the flare occurring at 03:35 ± 00:05 UTC, corresponding to the yellow square in first panel.
Current usage metrics show cumulative count of Article Views (full-text article views including HTML views, PDF and ePub downloads, according to the available data) and Abstracts Views on Vision4Press platform.
Data correspond to usage on the plateform after 2015. The current usage metrics is available 48-96 hours after online publication and is updated daily on week days.
Initial download of the metrics may take a while.