Fig. 4.
Download original image
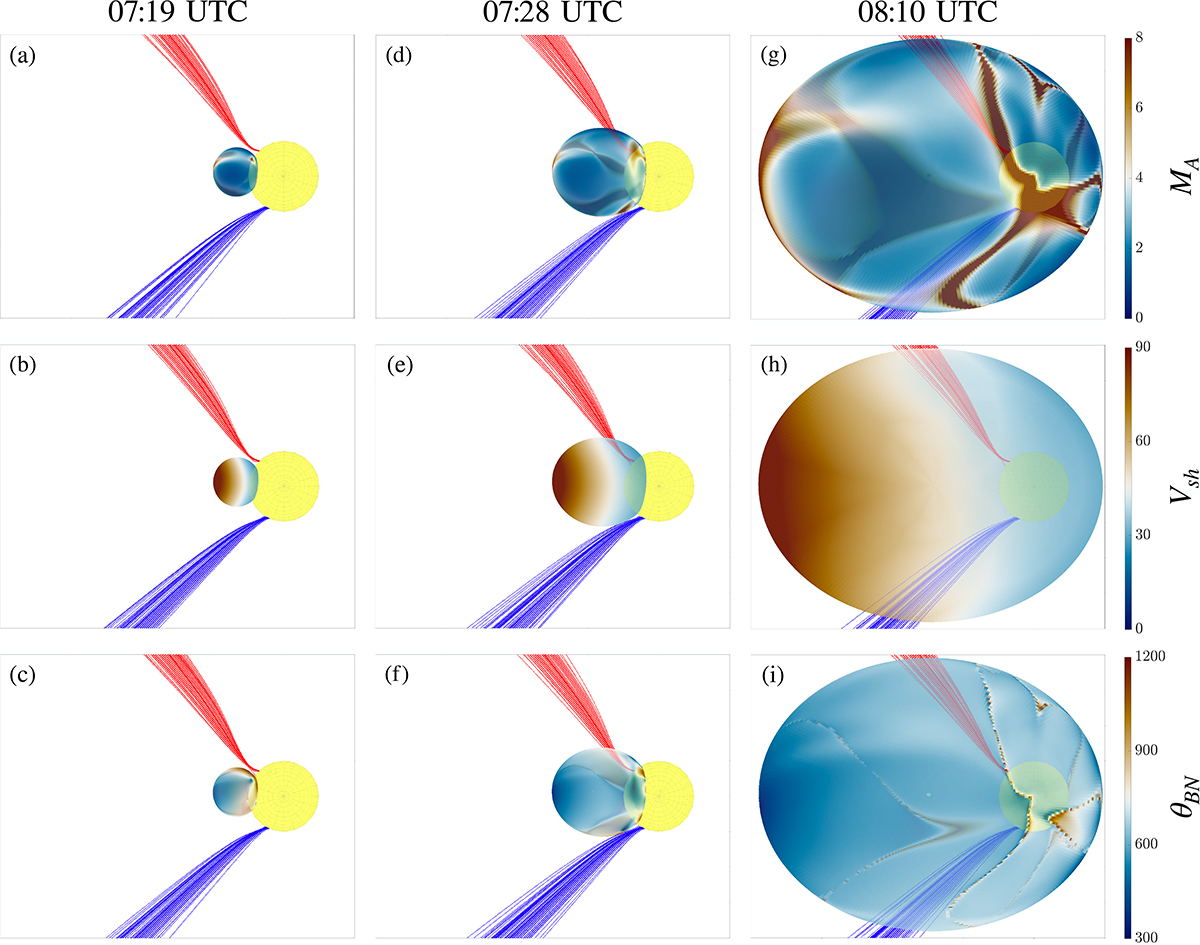
View of the ecliptic plane as seen from north, showing the results from the shock model in 3D and the magnetic connectivity. For each panel the yellow sphere represents the Sun in true scale, the coloured ellipsoid represents the reconstructed pressure–shock wave with a colour map that corresponds to the different shock parameters, the red and blue lines respectively represent the magnetic field lines connected to STA and STB spacecraft. These hundred connectivity lines are created according to a random number of latitude and longitude taken in a normal distribution around main latitude and longitude. The surface of the pressure–shock wave is coloured according to MA, Vsh, and θBN values in the top, middle, and bottom rows, respectively. From left to right, the panels show the shock position at 07:19, i.e. just before its connection to STA field lines; at 07:28, just before the connection to STB field lines; and at 08:10, when the shock has been connected to both spacecraft (times in UTC).
Current usage metrics show cumulative count of Article Views (full-text article views including HTML views, PDF and ePub downloads, according to the available data) and Abstracts Views on Vision4Press platform.
Data correspond to usage on the plateform after 2015. The current usage metrics is available 48-96 hours after online publication and is updated daily on week days.
Initial download of the metrics may take a while.