Fig. 3.
Download original image
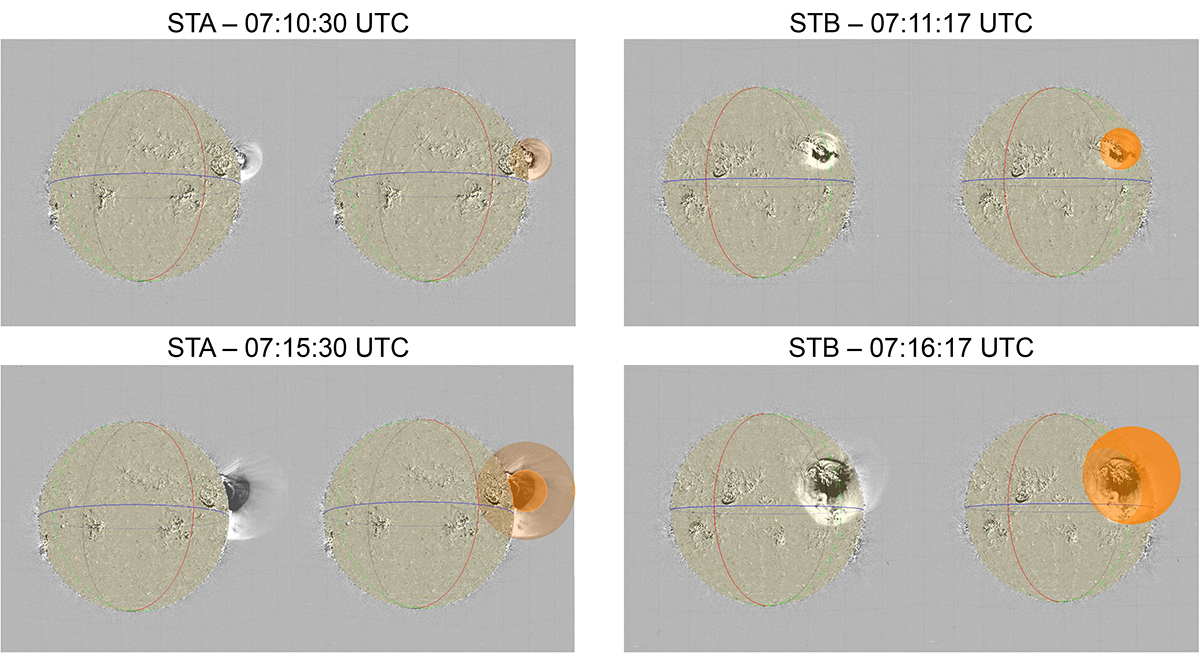
Running difference EUV images of the CME and the shock wave from two of the three viewpoints utilised in this study. The left panels are images from STEREO-A and the right panels from STEREO-B. The shape of the triangulated shock-wave using a 3D ellipsoid model is shown in orange, for t = 07:11 UTC (top panels) and t = 07:16 UTC (bottom panels).
Current usage metrics show cumulative count of Article Views (full-text article views including HTML views, PDF and ePub downloads, according to the available data) and Abstracts Views on Vision4Press platform.
Data correspond to usage on the plateform after 2015. The current usage metrics is available 48-96 hours after online publication and is updated daily on week days.
Initial download of the metrics may take a while.