Fig. 14.
Download original image
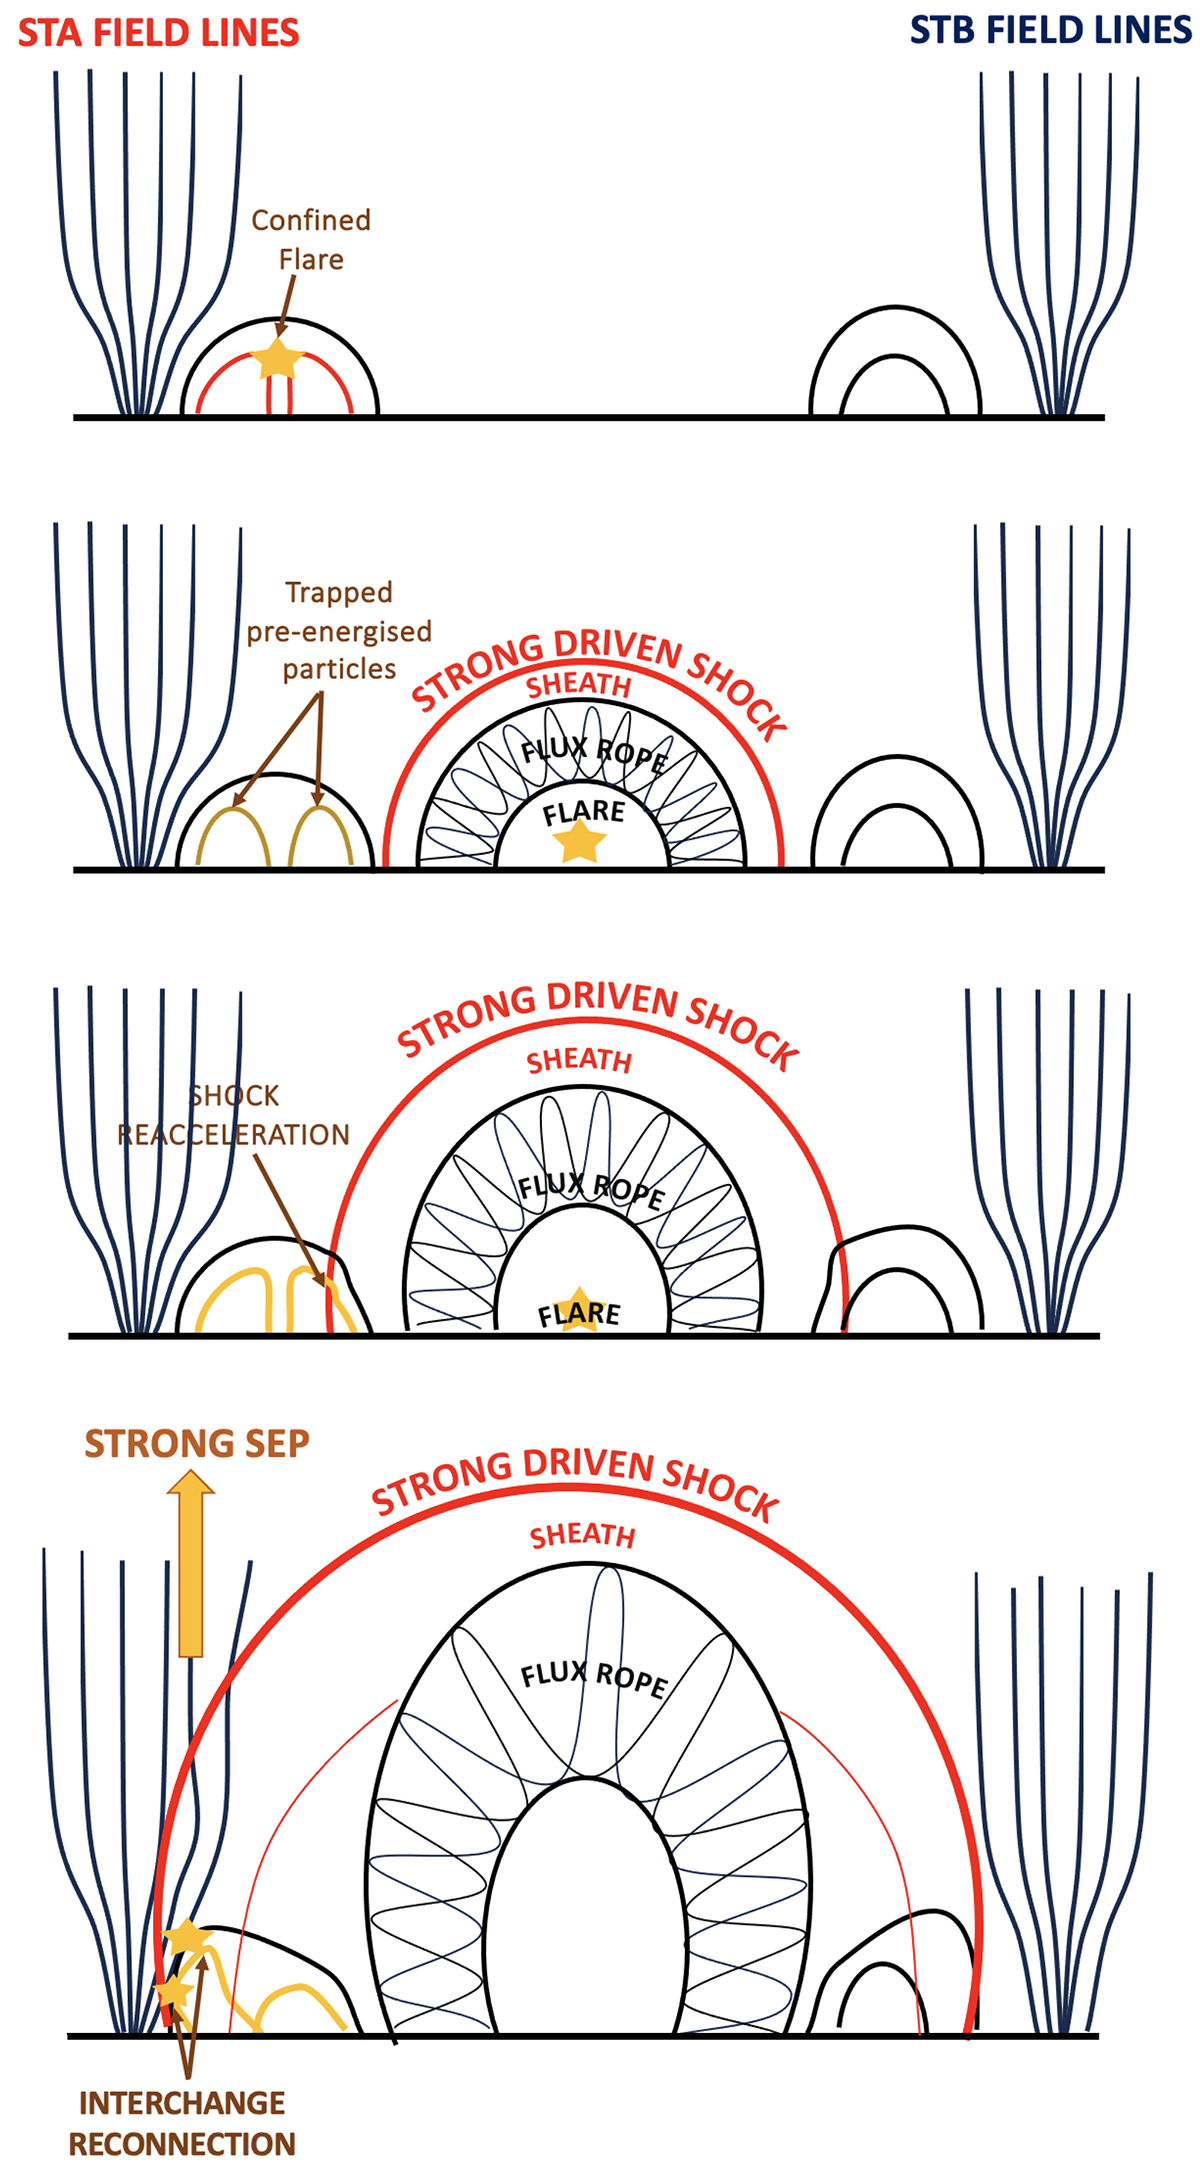
Proposed sequence of events to explain the properties of the 11 October 2013 SEP intensities at STA and STB. The top panel represents the configuration of magnetic field lines before the event, with STA-connected field lines on the left and STB-connected field lines on the right. The red lines in the top panel represent the confined flare of ≈03:35 UT. As the pressure wave forms around the expanding CME flux rope, open and closed magnetic field lines are pushed aside and are potentially forced to undergo interchange reconnection. Initially trapped pre-energised particles are suddenly released into open fields in the vicinity of the shock for further acceleration.
Current usage metrics show cumulative count of Article Views (full-text article views including HTML views, PDF and ePub downloads, according to the available data) and Abstracts Views on Vision4Press platform.
Data correspond to usage on the plateform after 2015. The current usage metrics is available 48-96 hours after online publication and is updated daily on week days.
Initial download of the metrics may take a while.