Fig. 5
Download original image
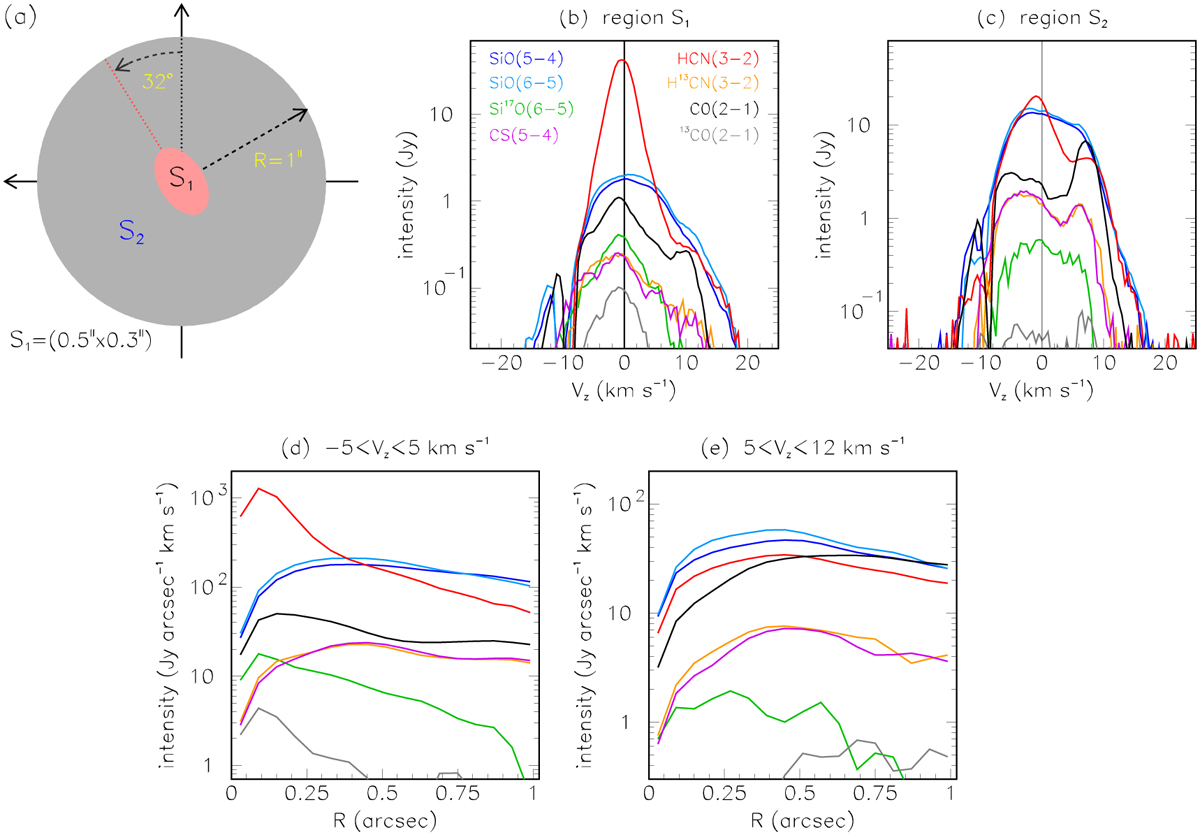
A-configuration data. (a) Definition of regions S1 and S2; (b) and (c): Doppler velocity spectra integrated over regions S1 (b) and S2 (c), respectively; (d) and (e): R distributions integrated over |Vɀ|<5 km s–1 (d) and 5<Vɀ<12 km s–1 (e), respectively. They are azimuthally integrated over the whole ring, such that the areas under the curves measure the total emission.
Current usage metrics show cumulative count of Article Views (full-text article views including HTML views, PDF and ePub downloads, according to the available data) and Abstracts Views on Vision4Press platform.
Data correspond to usage on the plateform after 2015. The current usage metrics is available 48-96 hours after online publication and is updated daily on week days.
Initial download of the metrics may take a while.