Fig. 3
Download original image
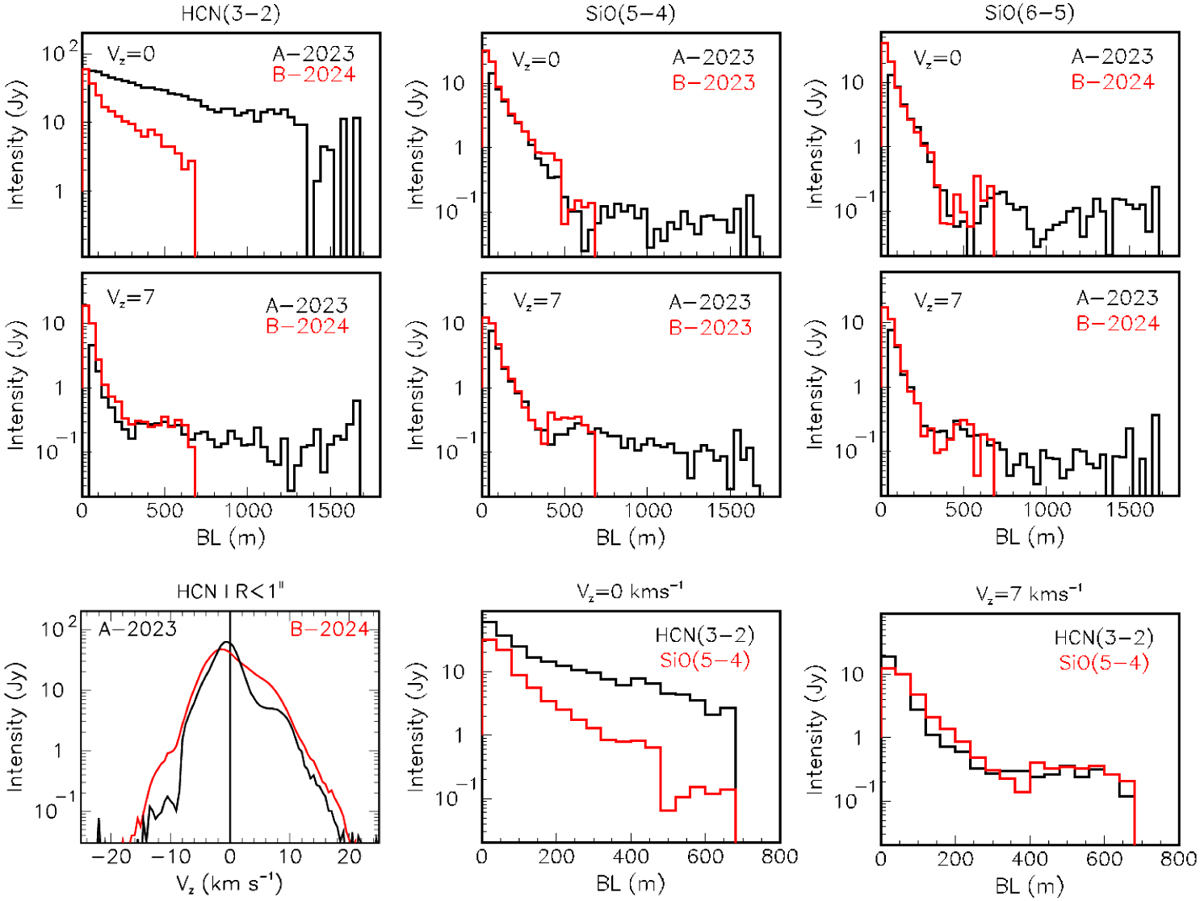
Distributions of the absolute values of the observed visibilities (Jy) over baseline lengths (m). In the upper and middle rows, we show the A-configuration (black) and B-configuration (red) separately for three different emission lines and two different Doppler velocity channels. The upper row corresponds to the frequency channel of the systemic star velocity (Vɀ =0). The middle row corresponds to Vɀ =7 km s–1. In each triplet, from left to right, the lines are H12CN(3–2), Si16O(ν=0, J=5–4) and Si16 O(ν=0, J=6–5). A-configuration observations were made in 2023 while B-configuration observations were made in 2023 for the low frequency setup, here Si16O(5–4), and in 2024 for the high frequency setup, here H12CN(3–2) and Si16O(6–5). Lower row: the left panel compares the H12CN(3–2) Doppler velocity spectra integrated over R<1 arcsec observed in 2023 (A-configuration, black) and in 2024 (B-configuration, red) shown on the left. The rightmost panels show only data observed using the B-configuration. They correspond to Doppler velocity channels of 0 and 7 km s–1 respectively. Black is for H12CN(3–2) and red for SiO(5–4).
Current usage metrics show cumulative count of Article Views (full-text article views including HTML views, PDF and ePub downloads, according to the available data) and Abstracts Views on Vision4Press platform.
Data correspond to usage on the plateform after 2015. The current usage metrics is available 48-96 hours after online publication and is updated daily on week days.
Initial download of the metrics may take a while.