Fig. 16
Download original image
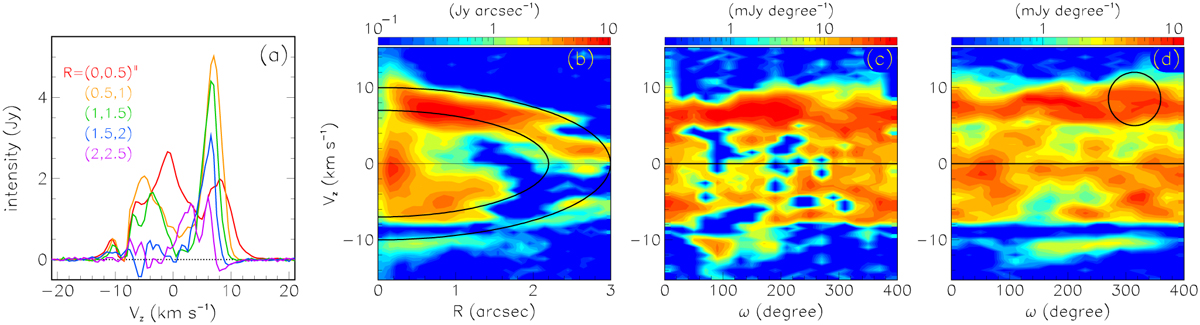
12CO(2−1) line emission (merged data). (a) Doppler velocity spectra in different intervals of R as indicated in the insert. (b) Vz vs. R map integrated over position angles. The lines show thin spherical shells emitted 250 years ago with radial velocities of 10 and 7 km s−1, respectively. (c) Vz vs. ω map integrated in the interval 0.2<R<2.5 arcsec. (d) Vz vs. ω map integrated in the interval 0.2<R<0.6 arcsec. The circle indicates the region covered by the red-shifted north-western octant discussed in Sect. 3.3.
Current usage metrics show cumulative count of Article Views (full-text article views including HTML views, PDF and ePub downloads, according to the available data) and Abstracts Views on Vision4Press platform.
Data correspond to usage on the plateform after 2015. The current usage metrics is available 48-96 hours after online publication and is updated daily on week days.
Initial download of the metrics may take a while.