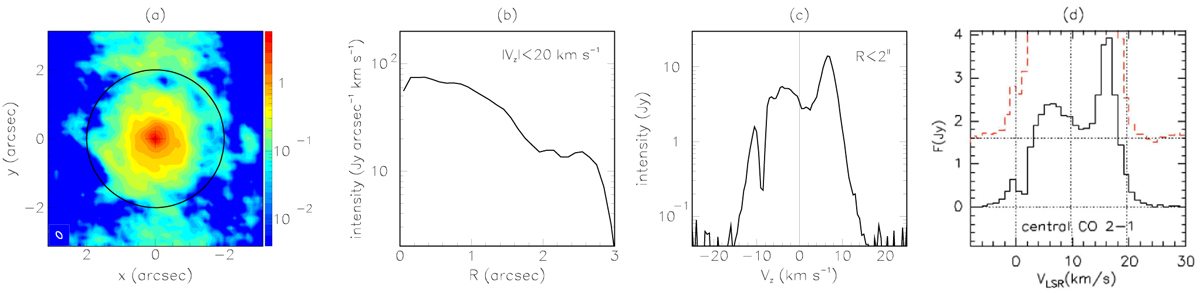
Fig. 14
Download original image
12CO(2−1) line emission. From left to right: intensity map (Jy beam−1 km s−1 ) integrated in the interval |Vz|<20 km s−1 (the circle has a radius of 2 arcsec), radial distribution integrated in the same interval of Vz ; Doppler velocity spectrum integrated over R<2 arcsec. The rightmost panel (linear scale) is from Castro-Carrizo et al. (2010). The noise level is 24 mJy beam−1 km s−1.
Current usage metrics show cumulative count of Article Views (full-text article views including HTML views, PDF and ePub downloads, according to the available data) and Abstracts Views on Vision4Press platform.
Data correspond to usage on the plateform after 2015. The current usage metrics is available 48-96 hours after online publication and is updated daily on week days.
Initial download of the metrics may take a while.