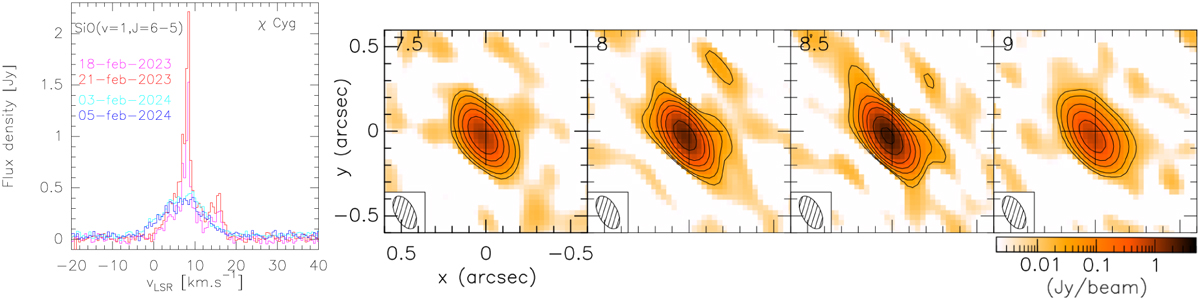
Fig. 13
Download original image
Si 16O(v=1, J=6−5) line emission. Left: Doppler velocity spectra integrated over a square of 2 × 2 arcsec2 centred at the origin. Right: Channel maps (Jy beam−1 ) of the 2023 A-configuration observations between Vz= −2.5 and −1 km s−1 (values of Vlsr are indicated in the upper-left corner of each panel). The contours are at 3, 6, 15, 30, 60, 150, and 300 times the noise level (see Table 1).
Current usage metrics show cumulative count of Article Views (full-text article views including HTML views, PDF and ePub downloads, according to the available data) and Abstracts Views on Vision4Press platform.
Data correspond to usage on the plateform after 2015. The current usage metrics is available 48-96 hours after online publication and is updated daily on week days.
Initial download of the metrics may take a while.