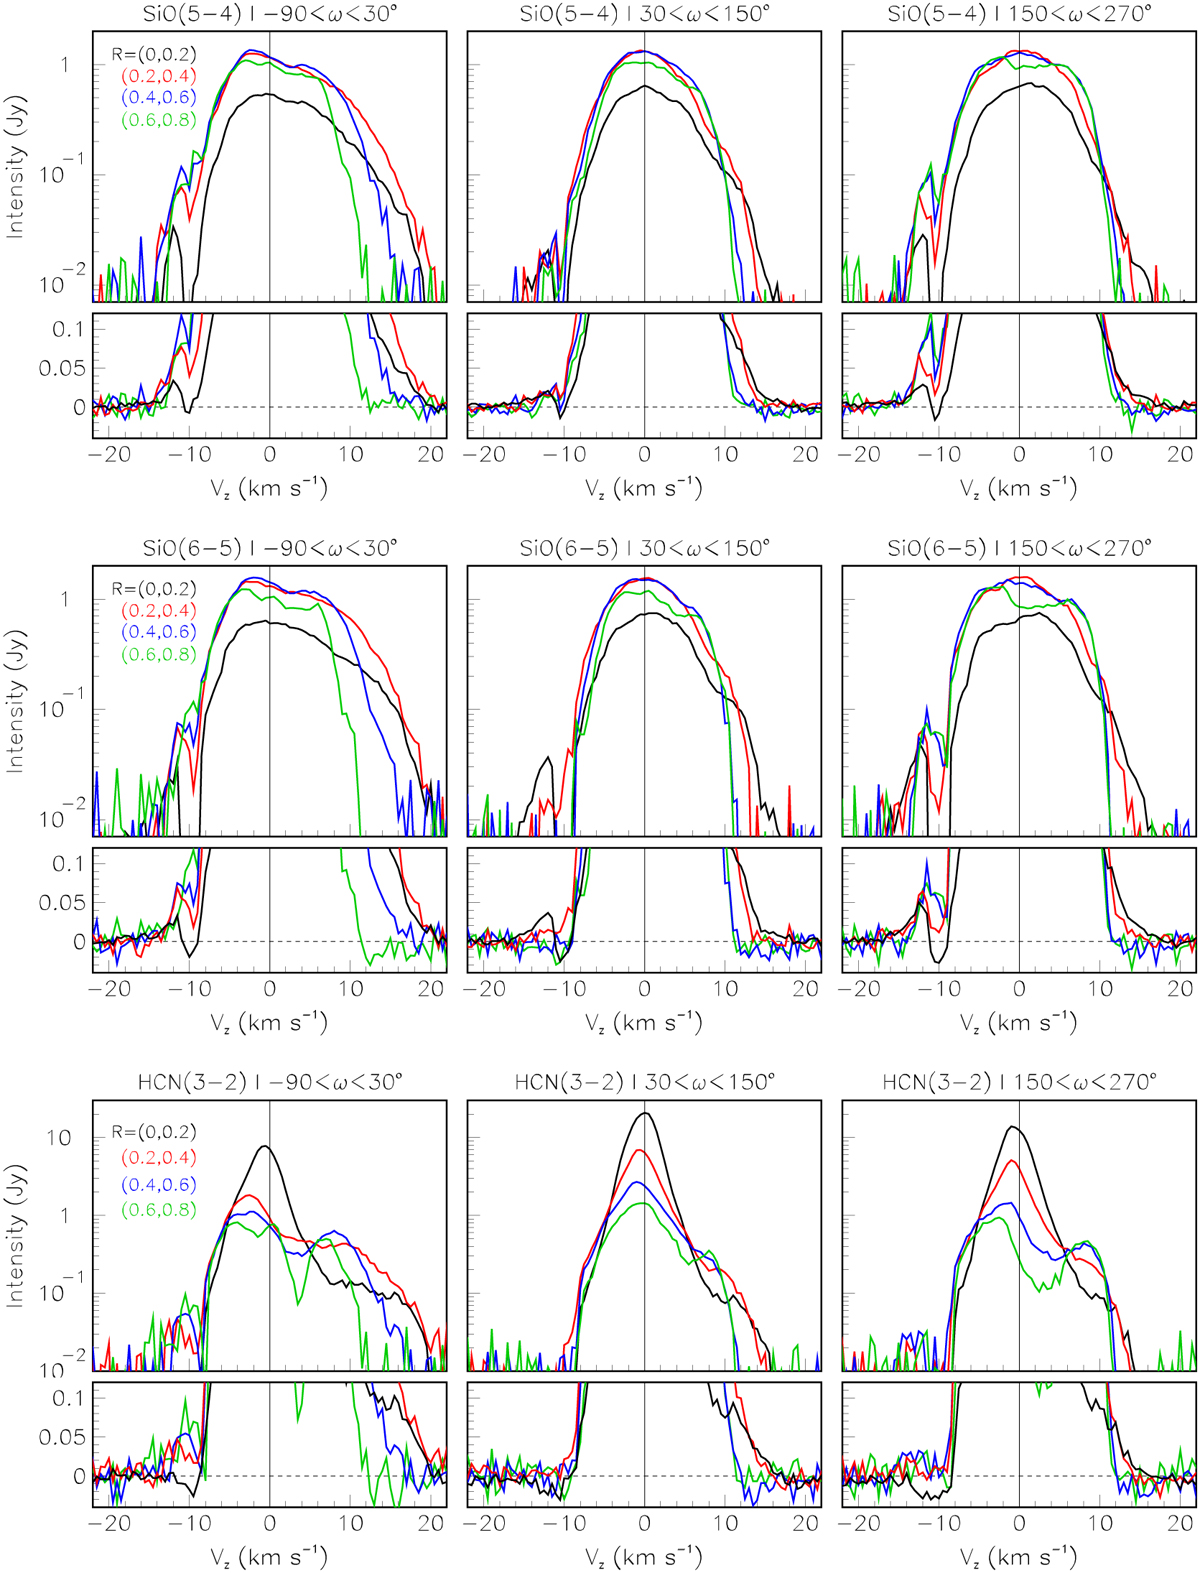
Fig. 12
Download original image
Doppler velocity spectra integrated over three intervals of position angles and four intervals of R. The lines and position angle intervals are indicated on top of each panel. R intervals are 0 to 0.2 arcsec (black), 0.2 to 0.4 arcsec (red), 0.4 to 0.6 arcsec (blue), and 0.6 to 0.8 arcsec (green). In each panel, the upper part shows the line profiles in logarithmic scale and the lower part shows them in linear scale.
Current usage metrics show cumulative count of Article Views (full-text article views including HTML views, PDF and ePub downloads, according to the available data) and Abstracts Views on Vision4Press platform.
Data correspond to usage on the plateform after 2015. The current usage metrics is available 48-96 hours after online publication and is updated daily on week days.
Initial download of the metrics may take a while.