Fig. 10
Download original image
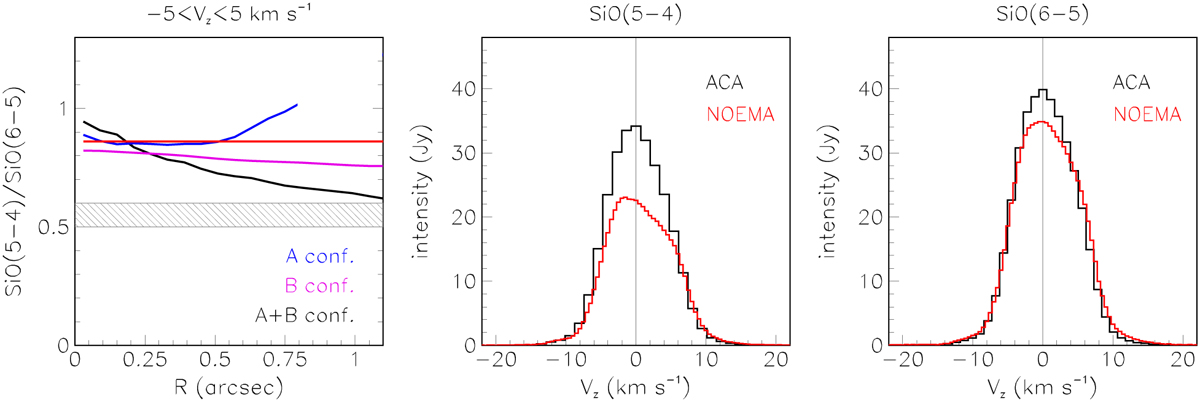
Radial distribution of the observed SiO(5–4)/SiO(6–5) intensity ratio (left). The band between 0.5 and 0.6 shows the prediction of a simple LTE model. The red line shows the value measured by ALMA/ACA. The blue curve uses the 2023 A-configuration observations, which suffer from a small maximal recoverable scale. The B- and A+B-configuration histograms, shown in magenta and black respectively, combine 2023 and 2024 observations and therefore suffer from a possible variability between the two years. Centre and right panels show the Doppler velocity spectra measured using ALMA/ACA compared with the present NOEMA observations integrated over R<1.5 arcsec.
Current usage metrics show cumulative count of Article Views (full-text article views including HTML views, PDF and ePub downloads, according to the available data) and Abstracts Views on Vision4Press platform.
Data correspond to usage on the plateform after 2015. The current usage metrics is available 48-96 hours after online publication and is updated daily on week days.
Initial download of the metrics may take a while.