Fig. 5
Download original image
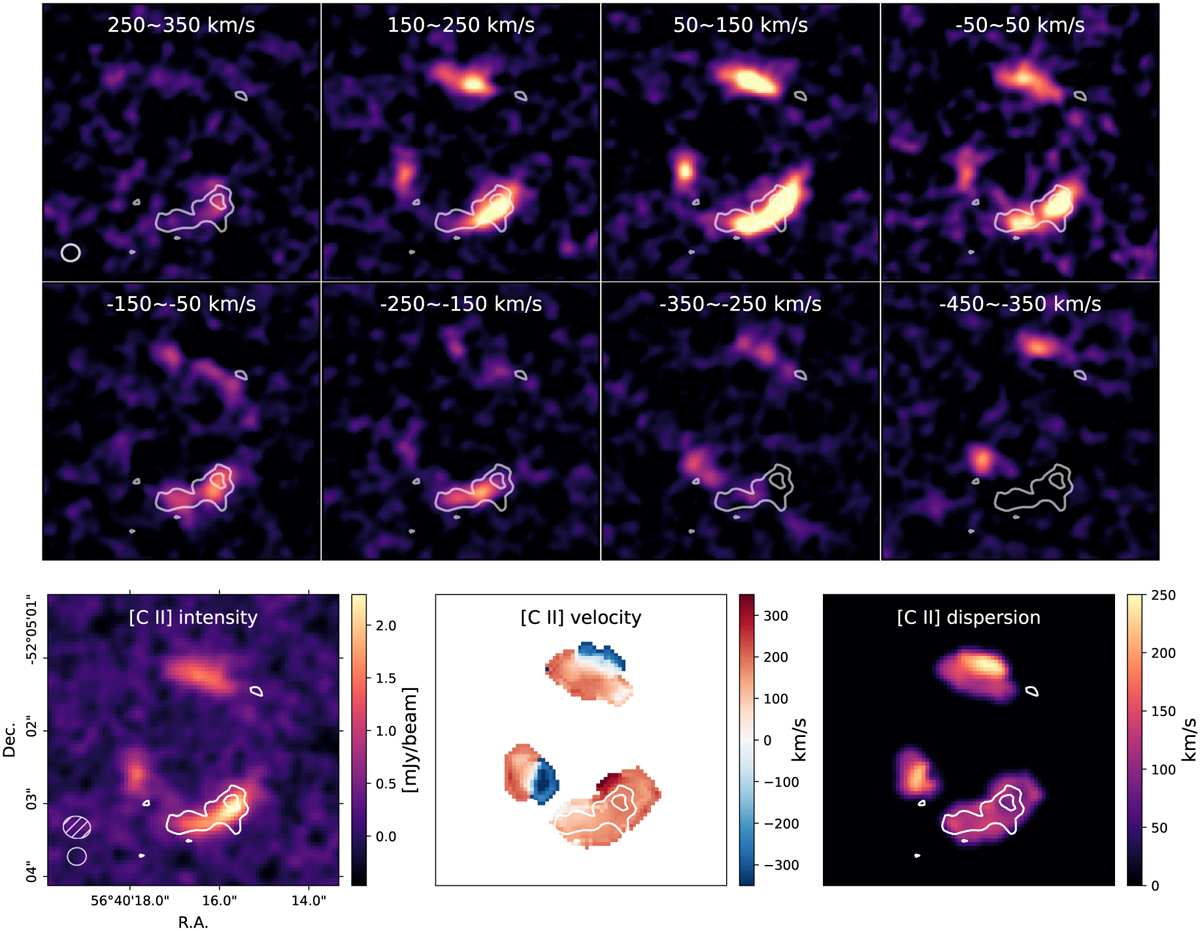
A comparison of polarised dust emission and the cold gas kinematics. Top: the channel maps of [C II] emission in a velocity bin of 100 km s−1. The white contours show the polarised dust emission as in Fig. 1. The white open ellipse in the bottom-left corner shows the final clean beam of the [C II] (0.25″ × 0.24″). The polarised dust emission mostly overlapped with the velocity component near ~−150 km s−1, which indicates it may only associate with some particular velocity components. Bottom: the comparison of the spatial distribution between polarised dust with the total intensity, velocity and velocity dispersion of [C II]. The peak of the polarised dust emission comes closer to the peak of [C II] emission than the total dust emission, and it is co-spatial with the region with a shallow velocity gradient and relatively low-velocity dispersion.
Current usage metrics show cumulative count of Article Views (full-text article views including HTML views, PDF and ePub downloads, according to the available data) and Abstracts Views on Vision4Press platform.
Data correspond to usage on the plateform after 2015. The current usage metrics is available 48-96 hours after online publication and is updated daily on week days.
Initial download of the metrics may take a while.