Fig. 3
Download original image
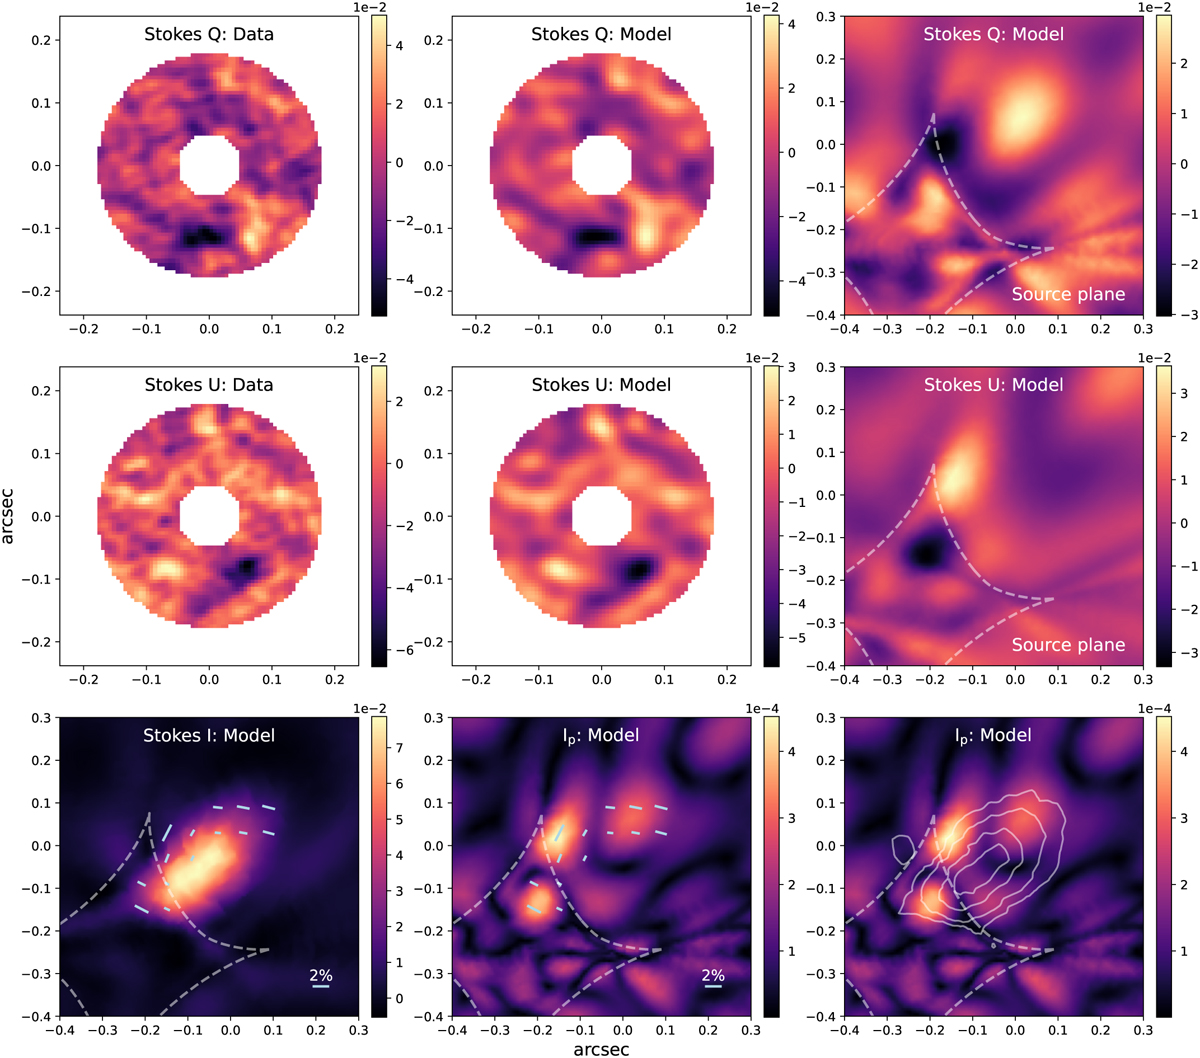
Pixellated lensing reconstruction of the full-polarisation dust emission. The first two rows show the lens modelling of Stokes Q and U, respectively. The first column shows the masked observational Stokes Q and U data fed to the lens model. The middle and right columns show the best-fit model in the image and source planes. The bottom row shows the recovered total dust emission and the polarised dust emission. The dashed white line indicates the caustic in the source plane. The light blue vectors show the orientation of the magnetic fields in the source plane. The full-polarisation model in the source plane shows a patchy distribution of polarised dust emission and offsets from the strongest total dust emission. The recovered field lines reveal an asymmetric distribution, present only on the north and east sides of the lensed galaxy, which is similar to the Antennae galaxies.
Current usage metrics show cumulative count of Article Views (full-text article views including HTML views, PDF and ePub downloads, according to the available data) and Abstracts Views on Vision4Press platform.
Data correspond to usage on the plateform after 2015. The current usage metrics is available 48-96 hours after online publication and is updated daily on week days.
Initial download of the metrics may take a while.