Fig. 2
Download original image
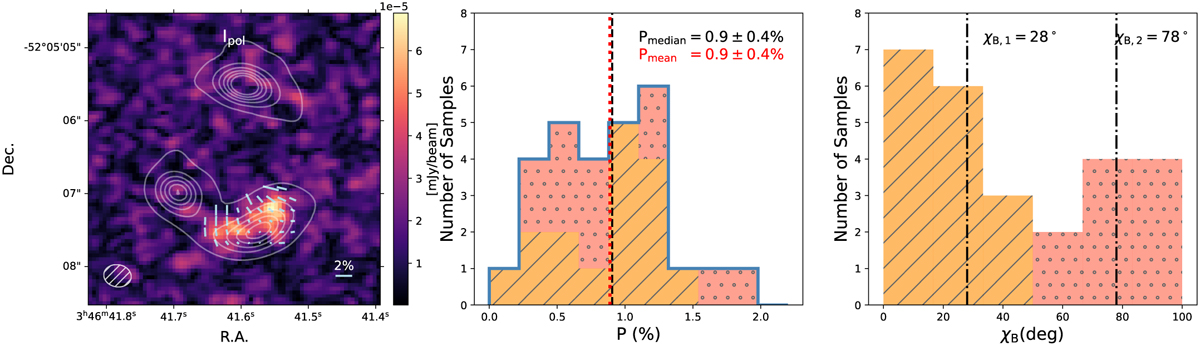
Spatial distribution and statistics of the polarised dust emission. Left: comparison between the polarised and total intensity of dust emission. The background image shows the polarised intensity, Ipol, and the white contours show the significant levels of Stokes I (same as Fig. 1). The peak of the polarised dust emission shows a slight offset (~0.2″) from the peak of the total dust emission, potentially due to an increment of the turbulent field and/or tangled magnetic fields along the line of sight. Middle + Right: histogram of measured polarisation fractions (P) and inferred position angles of magnetic fields (χB). Individual measurement is sampled from the region with P ≥ 3σP with the aperture size that is half the clean beam. The whole region with polarisation detection has a median polarisation fraction of 0.9 ± 0.2% with a variation of 0.4%. It also shows two peaks in the distribution of position angles at χB,ı ~28 degrees (diagonal hatched area) and χB,2 ~78 degrees (dotted hatched area).
Current usage metrics show cumulative count of Article Views (full-text article views including HTML views, PDF and ePub downloads, according to the available data) and Abstracts Views on Vision4Press platform.
Data correspond to usage on the plateform after 2015. The current usage metrics is available 48-96 hours after online publication and is updated daily on week days.
Initial download of the metrics may take a while.